How to Read a Crash Dump Like a Detective Reads a Crime Scene

The Scene of the Incident

When a process terminates unexpectedly, it leaves behind a record—a crash dump. This binary artifact contains the exact state of the application at the moment of failure: register contents, memory allocations, thread stacks, and loaded modules. To the uninitiated, a dump file appears as an impenetrable wall of hexadecimal addresses. To the trained investigator, it is a detailed account of what went wrong and why.

Forensic analysis of crash dump data on screen

I have spent years analyzing crash dumps in production environments. The methodology I apply mirrors the systematic approach a detective uses at a crime scene: secure the scene, collect evidence, interview witnesses, establish motive, and build a case. Every address is a fingerprint. Every stack frame is a testimony. Every exception record is a smoking gun.

Securing the Scene: Initial Triage

Before touching evidence, a detective secures the perimeter. In crash dump analysis, this means understanding the basic parameters of the failure before diving into memory contents.

Identifying the Victim

The first question: what process crashed? The dump header reveals the process name, PID, and architecture. A 32-bit dump analyzed with 64-bit tools produces misleading results. Verify the architecture matches your debugging tools.

Open the dump in WinDbg or cdb and execute:

! or .exepath to confirm module loading paths are correct. A missing symbol path means you are working blind—resolve this before proceeding.

Establishing the Time of Death

The exception record timestamp and process uptime tell you when the crash occurred relative to process start. A crash at 2 seconds uptime points to initialization failure. A crash at 14 days suggests resource exhaustion or a rare race condition.

Collecting Physical Evidence: The Exception Record

The exception record is the murder weapon. It tells you exactly what killed the process. The .exr command in WinDbg displays the exception code, faulting address, and flags.

Common exception codes read like a forensic catalog:

  • 0xC0000005 (ACCESS_VIOLATION) — A null reference or invalid memory access. The bread and butter of .NET crashes.
  • 0xE0434352 (CLR_EXCEPTION) — A managed exception propagated to native code.
  • 0x8007000E (E_OUTOFMEMORY) — The process exhausted available memory.
  • 0xC00000FD (STACK_OVERFLOW) — Unbounded recursion consumed the stack.

The faulting address in the exception record identifies the instruction pointer at the moment of the fault. This address is your primary lead—treat it accordingly.

Lines of code on monitor representing stack trace analysis

Interviewing Witnesses: Call Stack Analysis

A single stack frame tells you little. The full call stack—the chain of function calls from program entry to crash site—provides the narrative. This is witness testimony, and like any testimony, it requires corroboration.

Reading the Stack

Execute kP in WinDbg to display the call stack with full parameters. For managed code, !ClrStack or !dumpstack provides the mixed-mode view. The stack reveals the sequence of events leading to the crash.

Consider this scenario: the crashing instruction resides in System.String.Concat, but the faulting address is 0x00000000. The null reference did not originate in Concat—it was passed as an argument. Walk the stack upward to find which caller supplied the null value.

Corroborating Testimony

Symbols and source line information make the stack readable. Without symbols, you see raw addresses instead of function names. Always configure your symbol server. For .NET assemblies, use SOS (.loadby sos clr) to resolve managed method names.

Multiple threads provide multiple witnesses. Execute ~*k to dump all thread stacks. Look for:

  • Threads blocked on the same lock (deadlock candidates)
  • Threads performing identical operations (race condition indicators)
  • Thread pool saturation (resource exhaustion)

Examining the Scene: Memory Forensics

The state of memory at crash time is the physical evidence left at the scene. Registers, heap objects, and global state all contribute to the investigation.

Register Contents

The r command displays register values. In x64 calling convention, rcx holds the first argument, rdx the second. If the crash is an access violation on rcx, the first parameter was null. This single observation can eliminate hours of speculation.

Heap Object Inspection

For managed objects, !DumpHeap enumerates the managed heap. Combined with !DumpObj, you can inspect any object's fields. For native allocations, !heap -s summarizes heap state, and !heap -p -a <address> traces allocation call stacks when page heap is enabled.

Data visualization representing memory layout analysis

Garbage Collector State

The !EEHeap -gc command shows generation sizes and heap segments. A generation 2 size measured in gigabytes indicates long-lived object accumulation. The !gchandles command reveals pinned objects and handle counts—critical data when investigating memory leaks in .NET applications.

Establishing Motive: Root Cause Analysis

A detective asks: why did this happen now? The crash dump shows what failed, but the root cause often lies in the conditions that preceded the failure.

Temporal Analysis

Examine the thread that crashed. Was it processing a user request? Executing a background task? Performing garbage collection? The thread's start routine and current activity establish context for the failure.

Environmental Factors

Check module versions with lmv. A mismatched DLL version between environments can introduce bugs absent in testing. The !vmmap command reveals virtual address space consumption—critical for understanding memory pressure preceding the crash.

Concurrency Evidence

When multiple threads access shared state, the order of operations becomes significant. Look for lock objects with !syncblk. A thread holding a lock while crashed indicates the lock will never release—a potential deadlock source for other threads observed in ~*k.

Building the Case: Correlating Evidence

Individual clues mean little without correlation. The crash address, call stack, register values, and heap state must form a coherent narrative.

Document each finding. Write down the exception code, the faulting instruction, the stack trace, and the register values. Map connections between them. If the access violation occurred at MyApp.OrderProcessor.Process+0x45 and rcx was null, the null reference originated in the caller's argument to Process.

Verify your theory against the evidence. Does your explanation account for every observed anomaly? A theory that explains six observations but contradicts one is likely wrong or incomplete.

Common Patterns

After analyzing enough dumps, patterns emerge:

  • NullReferenceException in a property getter — Often caused by an object accessed after disposal or a race condition during shutdown.
  • OutOfMemoryException with ample physical RAM — Virtual address space exhaustion in 32-bit processes, or a single oversized allocation request.
  • StackOverflowException in recursive algorithms — Missing termination condition, or unexpected input creating deeper recursion than anticipated.
  • AccessViolation in unmanaged interop — Marshaling errors, incorrect P/Invoke signatures, or use-after-free in native dependencies.

Each pattern has a signature in the dump. Learn to recognize them the way a detective recognizes common exception patterns in their jurisdiction.

Closing the Case

A crash dump is frozen time. The registers, memory, and threads captured in that file are immobile witnesses that never forget and never contradict themselves. The investigator's task is methodical extraction and correlation of facts.

Start with the exception record. Follow the call stack. Examine the registers and heap. Correlate the evidence into a narrative that explains the failure. The process demands patience and precision, but the result—a definitive root cause—eliminates speculation and enables a targeted fix.

Every crash tells a story. Learn to read it.

FAQ

What is the difference between a minidump and a full dump?

A minidump contains select memory regions—typically thread stacks, module information, and limited heap data. A full dump captures the entire virtual address space of the process. Minidumps are smaller and faster to generate, but they may lack the heap data needed to inspect objects referenced by the crashing thread. For thorough analysis, configure your error reporting to capture full dumps.

Do I always need symbols to analyze a crash dump?

Symbols translate raw addresses into function names and source line numbers. Without symbols, you see hexadecimal addresses instead of meaningful names. Native Windows symbols are available from Microsoft's public symbol server. For your own code, build and archive PDBs alongside every released binary. SOS commands like !ClrStack work without PDBs for managed methods, but line numbers and local variable names require them.

How do I capture a crash dump automatically when a process fails?

Several tools enable automatic dump collection. Procdump -e -ma <pid> output.dmp monitors a process and writes a full dump on any unhandled exception. For system-wide collection, configure Windows Error Reporting registry keys to save dumps locally. For .NET applications, consider adding System.Environment.FailFast calls with custom telemetry that includes the dump path.


Aurora DSQL and the Quiet Maturation of Distributed SQL: What Amazon Actually Got Right

The Problem Nobody Wanted to Solve Directly

Distributed SQL databases have been promised to us for years. The pitch is clean and seductive: maintain ACID guarantees across multiple geographic regions, eliminate read replicas as a band-aid solution, offer true active-active architecture without the complexity that’s traditionally come with it. But the promise and the reality have remained stubbornly separated. I’ve watched companies adopt CockroachDB, Google Cloud Spanner, and other distributed SQL platforms, and every single deployment taught the same difficult lesson: you’re trading one set of constraints for another. You’re not eliminating complexity. You’re redistributing it.

Amazon’s announcement of Aurora DSQL at re:Invent 2024 landed differently than I expected. Not because it was shiny or unprecedented in its architecture, but because it represented Amazon actually building the boring, necessary infrastructure that makes distributed SQL viable for people who just want it to work. The database world is cluttered with technically impressive solutions that require significant engineering investment to operate. What I’m seeing in DSQL is different: an attempt to automate away the friction points that have kept distributed SQL adoption from crossing into mainstream infrastructure.

The Technical Foundation: Why Optimistic Concurrency Control Matters Here

Most traditional databases lean on Multiversion Concurrency Control, or MVCC. It’s battle-tested, well-understood, and performs predictably for single-region deployments. But MVCC carries a hidden cost in distributed systems: when you’re coordinating writes across multiple regions, the machinery becomes heavier. Every write needs careful orchestration to ensure that all versions are synchronized appropriately across geographies. The latency penalty is real.

Aurora DSQL steps away from this path. It implements an optimistic concurrency control model paired with an external transaction log that lives separately from the storage layer. This is not a new idea in computer science, but executing it well at scale is genuinely difficult. What Amazon claims here is that this separation reduces write latency by up to 40% in cross-region scenarios compared to traditional MVCC approaches. I’ve read enough technical papers and lived through enough latency investigations to know that a 40% reduction in cross-region write latency is not marketing noise. It’s the difference between applications feeling responsive and applications feeling like they’re swimming through molasses.

The external transaction log is a single source of truth for ordering and consistency. Writes commit optimistically at the local region, then get serialized through this centralized log. Conflicts are detected and handled at commit time rather than blocking writers preemptively. For most workloads, conflicts are rare, which means most writes proceed without friction. When conflicts do occur, the system has a clean mechanism for handling them. This is the kind of architectural choice that looks simple until you’ve spent six months running a distributed database in production and understood why every decision matters.

Availability Claims and What They Actually Mean

Amazon is positioning Aurora DSQL with a 99.999% multi-region availability guarantee. Five nines. That translates to roughly 26 seconds of downtime per year across all regions. It’s a number that matters primarily because it’s backed by something substantive: no read replicas required. Traditional active-passive architectures depend on read replicas to provide geographic redundancy and fault tolerance. They work, but they introduce operational complexity and potential inconsistency windows.

DSQL’s active-active model means every region is simultaneously primary. There’s no failover logic to orchestrate because there’s no standby waiting in the wings. The cluster handles member failures transparently. Data is distributed and replicated according to the quorum, not based on a hierarchy of primary and secondary nodes. This is closer to how Spanner operates, and Google has demonstrated over years that this model can deliver on its promises. Google Cloud Spanner maintains its 99.999% SLA across multi-region configurations and processes over 2 billion requests per second across its customer base, as documented in their 2024 Cloud Next presentation.

The real test isn’t whether the number is achievable theoretically. It’s whether AWS can operationalize it reliably across diverse customer workloads. That’s where the real work happens, and it’s where many distributed databases stumble. The infrastructure has to be mature enough to absorb cascading failures, network partitions, and the infinite edge cases that emerge when you run systems at scale across real geographies.

Positioning in the Competitive Landscape

Aurora DSQL entered general availability in Q1 2026 across four AWS regions, with pricing starting at $0.50 per DPU-hour (Database Processing Unit). That pricing directly positions it against CockroachDB Dedicated and Google Cloud Spanner. It’s not undercutting. It’s not trying to win on price alone. Amazon’s message is simpler: comparable performance, comparable availability, comparable pricing, but you don’t have to leave AWS to get it, and the operational model is built into the ecosystem you already inhabit.

The market agrees that this segment matters. Gartner’s 2025 Magic Quadrant for Cloud Database Management Systems identified distributed SQL as the fastest-growing segment, with adoption increasing 38% year-over-year among Fortune 500 companies. That’s not incremental growth. That’s acceleration. Organizations are actively moving away from the sharded-MySQL-on-steroids era and toward databases that were genuinely designed for geographic distribution from the ground up. The question for most teams isn’t whether to adopt distributed SQL anymore. It’s which one, and when.

The Honest Assessment and What It Means for Your Architecture

Here’s what I think is actually happening: Aurora DSQL represents Amazon taking the theoretical advantages of distributed SQL and wrapping them in enough operational scaffolding that teams without specialized distributed systems expertise can deploy them successfully. The technology itself is not revolutionary. The architecture choices are informed by years of work in the space. What’s valuable is the execution and the commitment to making it work within AWS’s operational model.

If you’re currently running application-level sharding, or maintaining separate databases in each region with eventual consistency, or dealing with the complexity of traditional read replicas, DSQL deserves a serious evaluation. The five-nines availability claim backed by active-active architecture is genuinely useful. The write latency improvements are substantive. The pricing is competitive. For teams already committed to AWS, the integration story is compelling.

The honest caveats: distributed SQL is still not a drop-in replacement for every use case. Complex analytics workloads, certain reporting patterns, and edge cases around transaction isolation might still require traditional approaches. But for operational systems that need geographic resilience and strong consistency guarantees, the platform has reached the point where it’s a legitimate architectural choice rather than a research project.

We’re finally moving past the era where distributed systems were inherently painful to operate. When major cloud providers build distributed SQL as a core offering and demonstrate 99.999% reliability at scale, the technology goes from promising to practical. If you’ve been waiting for the right moment to modernize your database infrastructure for geographic distribution, that moment is worth revisiting now. I’d be curious what challenges you’re facing with your current architecture. The constraints that made sense two years ago might not be the right constraints anymore.

OpenTofu 1.9 vs. Terraform 1.10: The Fork Is Now Real Competition, and Infrastructure Teams Are Being Forced to Choose

The Fork That Nobody Expected to Matter

When HashiCorp announced the Business Source License in August 2023, the infrastructure-as-code community did what it always does when a major vendor makes a controversial licensing move: it forked the project. What happened next was less predictable. The Linux Foundation-backed OpenTofu didn’t become a well-intentioned zombie fork that the community politely ignored. Instead, it became a legitimate competitor with real momentum, its own roadmap, and increasingly, its own users running production workloads on it.

By January 2026, the numbers are hard to dismiss. OpenTofu’s GitHub repository had surpassed 23,000 stars, and the project was reporting over 4 million weekly downloads according to its public transparency dashboard. That’s a roughly 2.7x increase from the 1.5 million weekly downloads reported at the fork’s initial launch. These aren’t vanity metrics. Downloads translate to adoption, and adoption translates to real infrastructure decisions being made differently than they would have been eighteen months ago.

The question is no longer whether OpenTofu is viable. The question is whether your organization needs to evaluate it alongside Terraform when planning your next infrastructure project or migration. That evaluation is now a legitimate part of the decision matrix, and it should be.

State Encryption and the Feature Gap That Matters

One specific technical distinction has emerged as more than just marketing copy. OpenTofu 1.9, released in late 2025, introduced native end-to-end state encryption as a core feature available to all users. Terraform’s open-source tier does not include this. You read that correctly. If you are using Terraform without a Terraform Cloud subscription, your state files are not encrypted at rest unless you implement encryption outside of Terraform itself, at the storage layer or through your remote backend configuration.

State files contain sensitive data. Database passwords, API keys, SSH private keys, authentication tokens—all of these live in your state. OpenTofu moving state encryption from “something you might do with additional tooling” to “something that comes built in” represents a real divergence in how these two projects now think about security by default. This is not a theoretical concern. Multiple organizations have disclosed that state file exposure was a component of their security incidents. When a tool born from a licensing dispute suddenly offers better baseline security than its parent project, infrastructure teams notice.

The practical implication is straightforward. If your organization has been building workarounds to encrypt Terraform state, whether through wrapper scripts, external tools, or elaborate backend configurations, OpenTofu 1.9 means you no longer need to maintain that workaround. Whether the reduction in operational complexity justifies a migration is a separate question, but the feature gap is real and measurable.

IBM’s Acquisition and the Perception of Stalled Innovation

In April 2024, IBM closed its acquisition of HashiCorp for $6.4 billion. The deal was presented as a strategic investment in infrastructure management and cloud transformation. From the perspective of Terraform’s open-source users, what followed was a concerning period of incremental releases and reduced momentum on the core tool that powers much of the infrastructure-as-code ecosystem.

Terraform 1.10 and subsequent releases have been characterized by incremental improvements rather than the kind of feature-driven development cycles that preceded the acquisition. This pattern is predictable when a startup becomes part of a publicly traded enterprise. The incentive structure shifts. The goal becomes integrating the acquired product into an existing enterprise sales motion, ensuring support for legacy customers, and building features that justify premium tiers and consulting services. Innovation on the open-source core becomes less central to the business plan.

This isn’t cynicism. This is how large technology acquisitions work. IBM did not pay $6.4 billion to maintain an egalitarian open-source project. IBM paid to acquire Terraform users and to build a premium platform business around infrastructure management. The consequence is that the open-source tool infrastructure teams rely on is no longer optimized for the needs of those teams. It’s optimized for IBM’s enterprise strategy. That misalignment is the real vulnerability OpenTofu exploits.

Migration Data That Cannot Be Ignored

In January 2026, Pulumi released the results of a State of Infrastructure as Code survey that included 1,200 platform engineers across enterprises of varying scales. The data revealed that 31% of respondents had already migrated at least one environment from Terraform to OpenTofu, up from 11% in the prior year’s survey. That is a tripling of migration activity in a single year.

Three in ten infrastructure engineers are now actively moving workloads to the fork. This is not a marginal phenomenon. This is a material shift in how organizations are evaluating their infrastructure-as-code strategy. The survey also indicated that the primary drivers for migration were concerns about licensing uncertainty, preferences for community-driven governance, and the desire to avoid vendor lock-in with IBM. The motivations are as much philosophical as they are technical, but philosophy drives infrastructure decisions just as powerfully as features do.

What makes this data particularly striking is that it reflects actual migration activity, not just interest or evaluation. These are organizations that have done the work to move their state, update their pipelines, and retrain their teams. That represents a substantial commitment. The fact that 31% of respondents had already done this work suggests that the barrier to migration is lower than many observers predicted, and that OpenTofu as a legitimate alternative is now a widely held view across the engineering population.

The CNCF Endorsement and What It Signals

In early 2025, the Cloud Native Computing Foundation’s Technical Oversight Committee formally accepted OpenTofu as a sandbox project. This is not a ceremonial designation. The CNCF sandbox pathway is the same governance structure that projects like Kubernetes, Prometheus, and Envoy used to achieve the kind of institutional legitimacy that enterprise organizations require before adopting new infrastructure tools. The CNCF endorsement means that OpenTofu now has the governance framework, the community oversight, and the institutional backing that removes the “but is it going to disappear?” question from the evaluation process.

For infrastructure teams that have been waiting for the fork to prove its staying power, the CNCF acceptance provided that proof. The Linux Foundation is managing the project, the governance is transparent and community-driven, and the development roadmap is publicly visible. The Linux Foundation OpenTofu project page provides the institutional framework. The OpenTofu official documentation and changelog reflects the velocity and direction of the project. These are not hypothetical commitments. This is an established foundation managing an established project with committed contributors and a public roadmap.

The practical consequence is that OpenTofu is no longer a fork you adopt against organizational resistance. It’s a CNCF project you adopt with institutional backing. That shift in positioning changes how procurement teams evaluate it, how security teams assess it, and how leadership teams think about the long-term support picture.

The Choice Is Real Now

Infrastructure teams are not facing a hypothetical decision anymore. OpenTofu has proven that it can maintain feature parity with Terraform, push beyond what Terraform offers on the open-source side, and build a community that is actively choosing it over Terraform in production environments. The fork is now real competition. The migration data is real. The feature gap is real. The governance is real.

What remains unsettled is whether your organization has a reason to evaluate the move. That depends on your current Terraform investment, your tolerance for migration risk, and your preferences around vendor relationships and open-source governance. Those are organizational questions, not technical ones. But the technical foundation for making that decision is now solid enough that deferring the evaluation is itself a choice worth examining.

What has been your experience with either project? Have you evaluated OpenTofu for any part of your infrastructure? The conversation around which direction the IaC ecosystem moves next is still forming, and it benefits from the input of people who are actually operating these tools at scale.

OpenTofu 1.9 and the Terraform Fork: What Actually Works in Production After 18 Months

The License Shift That Fractured an Ecosystem

In August 2023, HashiCorp did something that surprised exactly no one who had been paying attention to open-source licensing trends over the past decade. They moved Terraform from the Mozilla Public License 2.0 to the Business Source License 1.1. The BSL is not open source by OSSD definition, which meant that any organization at a certain scale would need to either negotiate with HashiCorp or find an alternative. The company argued this was necessary to protect their commercial interests against cloud providers building on Terraform without contributing back. Whether that argument held water depends largely on your perspective on what open source actually means, but the practical effect was immediate and severe.

Within weeks, the Linux Foundation moved. By September 2023, OpenTofu had been announced as a community-driven fork backed by major infrastructure companies. The speed of this response told you something important: organizations had been waiting for permission to do this, not necessarily the technical capability. By January 2024, OpenTofu hit 1.0 stable. It was, at that point, a faithful reproduction of Terraform’s functionality. It worked. It didn’t break things. For many organizations, this was enough. The fork was no longer theoretical.

When the Fork Actually Pulled Ahead

For months after OpenTofu 1.0 shipped, the narrative was predictable: it’s a good insurance policy, a hedge against future licensing changes, but Terraform remains the reference implementation. Then, in mid-2024, OpenTofu 1.8 arrived with something the community had been requesting for years: native provider-defined functions. This was not a minor feature. The ability to define functions within a provider, rather than requiring wrapper layers or external tooling, represented a genuine capability gap that Terraform still had not addressed.

I want to be precise about what this means. For years, practitioners had worked around this limitation through a combination of Terraform modules, locals blocks, and external data sources. It was workable but inelegant. When OpenTofu shipped this, it was the first moment where the fork was not just maintaining parity with the upstream project, but actively shipping features the upstream had deprioritized. The market noticed. This was not about HashiCorp malice or OpenTofu heroics. It was about prioritization, governance, and what happens when an open-source project can move faster than a company-backed one.

The IBM Acquisition and the Acceleration

HashiCorp’s acquisition by IBM closed mid-2024 for approximately 6.4 billion dollars. On paper, this should have been good news for Terraform users. IBM is a major infrastructure player with long-standing commitments to open-source projects. In practice, the post-acquisition product roadmap updates did almost nothing to reassure the community about the licensing direction or future commitment to open development. The messaging remained cautious and corporate. The open-source community, quite rightly, began planning for the scenario where the trend continued rather than reversed.

This is the moment where migration conversations shifted from hypothetical to urgent. Organizations that had been monitoring OpenTofu as an option began running serious pilots. The combination of licensing uncertainty, the IBM ownership transition, and the technical parity of the fork created the conditions for real migration rather than theoretical hedging.

Where We Actually Are: The Production Numbers

By early 2025, the OpenTofu registry had crossed 2,000 mirrored providers. This is not hypothetical coverage. For the vast majority of organizations running infrastructure on AWS, GCP, or Azure, functional parity is essentially complete. The long tail of specialized providers is still spottier, but for mainstream infrastructure use cases, the argument about fragmentation or incomplete tooling no longer holds up. OpenTofu official documentation and changelog shows a project that is methodical about its releases and conservative about breaking changes.

A Spacelift survey from late 2024 found something worth sitting with: 38 percent of organizations using Terraform were either actively evaluating or had already migrated to OpenTofu. The drivers were consistent across respondents. Cost uncertainty and licensing questions accounted for 91 percent of the stated reasons. This is not about philosophical opposition to commercial software. It is about predictability. Organizations want to know what the rules are, and they want confidence those rules will not change in ways that require painful re-architecture later.

I have worked through enough platform migrations to know what successful ones look like. They move methodically. They start with non-critical workloads. They build tooling to smooth the transition. What I am seeing with OpenTofu adoption follows that pattern almost exactly. Organizations are not abandoning Terraform in crisis mode. They are planning migrations that will take months, testing provider behavior, and running dual-stack infrastructure during transition windows. This is how mature organizations handle platform decisions.

What This Means for Your Infrastructure

The fork is no longer a theoretical option or a political statement. It is a production-ready alternative backed by major companies, with a governance model that is explicitly open, and with a feature roadmap driven by community request rather than vendor prioritization. The quality of implementation is solid. The pace of development is steady. The risk profile has shifted significantly since August 2023.

This does not mean Terraform is obsolete or that HashiCorp’s decisions were catastrophic. Terraform remains widely used, well-maintained, and appropriate for many organizations. What it does mean is that the ecosystem now operates with genuine choice for the first time in a decade. Organizations can make decisions based on their actual constraints rather than technological lock-in. The fork has normalized this conversation in a way that benefits everyone, including those who remain on Terraform.

If you are currently on Terraform and considering your options, the honest assessment is that OpenTofu is mature enough to migrate to with proper planning. If you are building new infrastructure, the choice is more genuinely open than it has been in years. Linux Foundation OpenTofu project page provides solid grounding for understanding the governance and roadmap. Eighteen months after the fork, the infrastructure provisioning space looks different than it did. That is worth understanding clearly, without hype in either direction. I am curious what your actual experience has been. Have you evaluated OpenTofu for your infrastructure? What drove your evaluation, and what did you find?

Kubernetes 1.32’s Sidecar Containers Finally Reach General Availability — And This Changes How We Build

The Problem Nobody Wanted to Admit Was a Problem

For years, running sidecar containers in Kubernetes felt like a workaround masquerading as a feature. You’d inject them through webhooks, manage their lifecycle through init containers with clever scripting, and hope the timing worked out. Service mesh teams like Istio built entire injection frameworks just to solve what should have been a first-class concern. The worst part wasn’t the complexity — it was that everyone knew it was suboptimal, yet we all kept building production systems on top of these patterns anyway.

When Kubernetes 1.32 promoted native sidecar container support to General Availability in December 2024, it wasn’t a flashy announcement. No keynote drama. No promises of revolutionary change. But if you’ve spent time in the trenches managing Kubernetes at scale, you recognized immediately that this mattered. After the feature first appeared as alpha in Kubernetes 1.28 back in August 2023, the platform finally gave us something we should have had from the beginning: a proper, native way to run containers that start before your application and clean up after it terminates.

How Native Sidecars Actually Work — And Why the Mechanics Matter

The implementation is deceptively simple, which is exactly what you want in infrastructure. Rather than bolting sidecars onto the Pod spec through injection webhooks, the new approach uses an ‘initContainers’ field paired with a ‘restartPolicy: Always’ designation. This tells Kubernetes something it never explicitly understood before: this container needs to start during pod initialization, run alongside the main application container, and continue running even after the main container terminates. Then, when the pod shuts down, the sidecar terminates cleanly as part of the normal shutdown sequence.

That ordering matters more than it sounds. Previously, there was no built-in mechanism to guarantee that your sidecar had finished initializing before your main application started trying to use it. You had readiness probes, startup probes, and various other coordination tricks, but these were all workarounds layered on top of a system that didn’t understand the relationship. Now the platform understands it natively. The sidecar starts first. Your application starts when the sidecar is ready. The application stops. The sidecar gets a clean signal to shut down. Then the pod is gone.

This matters because it eliminates entire classes of race conditions. Linkerd’s maintainers published benchmarks in early 2025 showing that Kubernetes-native lifecycle management eliminated a category of bugs responsible for roughly 8% of their reported production issues in 2024. That’s not marginal. That’s the difference between waking up at 2 AM for a page because your sidecar injection timing failed and sleeping through the night.

The Latency Gains Are Real — Especially Under Load

If pure correctness doesn’t move you, consider performance. The Istio service mesh team confirmed in their 2025 blog post that workloads using native sidecar support see pod startup latency reduced by up to 50% compared to the legacy injection model, particularly in environments with high churn where pods are constantly starting and stopping. Fifty percent. In high-frequency deployments, that translates to faster autoscaling response times, quicker recovery from failures, and generally snappier cluster behavior.

The reason for the speedup is straightforward: the old injection model required webhooks to intercept pod creation, mutate the specification, and inject the sidecar container after the fact. That added network round-trips and processing overhead on every single pod creation event. With native sidecars, there’s no indirection. The platform understands what you’re trying to do and does it directly. The math works out.

This also matters because service mesh adoption keeps climbing. According to the CNCF Annual Survey 2025, 52% of Kubernetes users are now running service meshes in production, up from 42% just two years ago. When more than half your ecosystem is building on top of sidecar injection patterns, making that injection faster and more reliable isn’t a minor optimization. It’s foundational.

What This Means for Your Infrastructure Today

GA doesn’t mean you need to rip out your existing service mesh setup tomorrow. Migration is a deliberate process, and most established mesh implementations will take time to integrate native sidecar support into their injection mechanisms. But if you’re starting a new project, or evaluating Kubernetes platforms, native sidecars are now a legitimate first-class primitive you can build on directly.

Beyond service meshes, this opens up cleaner patterns for logging, monitoring, security scanning, and protocol translation. Any use case that requires sidecar lifecycle management now has a more efficient foundation. You’re no longer fighting the platform to do something it should understand.

Kubernetes 1.32 is part of a larger maturation story worth paying attention to. When you look at the Kubernetes 1.32 Release Notes, you see a platform consolidating around production patterns and eliminating technical debt. That’s not exciting the way a brand-new feature is exciting, but it’s the kind of boring, intentional engineering that makes large-scale systems actually work.

Where We Go From Here

The real value of native sidecar support won’t be obvious until you’re several quarters into running production workloads that depend on it. You’ll notice that pod startup times are more predictable. You’ll see fewer edge cases in your observability stack where sidecar containers didn’t initialize properly. Your on-call rotation won’t include that one weird class of bug that only happened under specific timing conditions. These aren’t headline features, but they’re what separates systems that mostly work from systems you actually trust with your business.

If you’re already running Kubernetes in production, take some time to understand how native sidecars work and what your mesh provider’s roadmap looks like for adoption. If you’re planning new infrastructure, make native sidecars part of your decision matrix. This is one of those features that doesn’t announce itself loudly, but once you start using it, you wonder how you ever built without it. I’d be curious to hear about your experiences as you explore this — the corner cases and patterns you discover often reveal what’s really happening at the edges of these systems.

OpenTofu vs. Terraform in 2026: The Fork Has Matured and the Decision Is No Longer Obvious

The License Change That Started Everything

In August of 2023, HashiCorp made a decision that reshaped the infrastructure-as-code landscape. They moved Terraform from the Mozilla Public License to the Business Source License, a move that sent ripples through every organization running Terraform at scale. I remember reading the announcement and immediately understanding what was coming. The BSL model means the code is open and readable, but commercial use requires a license after a certain threshold. For companies, this created genuine uncertainty about their existing deployments and future commitments.

The Linux Foundation didn’t wait long to act. OpenTofu emerged as a fork, maintained under governance that promised to keep the project genuinely open. It was a fork born not from technical disagreement but from philosophical and business model concerns. At the time, many dismissed it as a reaction that wouldn’t survive long term. Forks often don’t. This one did something different.

Two Years of Divergence: Feature Parity Shifts

What matters most when evaluating these tools in 2026 isn’t the licensing debate anymore. The technical landscape has shifted beneath that argument. OpenTofu released version 1.9 in late 2025, and this version introduced capabilities that remain absent from Terraform’s corresponding releases. Provider-defined functions arrived first in OpenTofu, giving providers the ability to expose custom logic directly to your configuration. State encryption, a feature that should have been table stakes years ago, also shipped in OpenTofu ahead of its Terraform equivalent.

This matters more than people think. When a fork starts shipping features faster than the original, it signals something real about momentum and prioritization. I’ve watched enough projects to know the difference between a temporary lead and a structural advantage. OpenTofu’s official documentation and changelog shows commit frequency that exceeded HashiCorp’s Terraform in several consecutive months through 2025. That’s not noise. That’s an active community making deliberate choices about where to invest engineering effort.

The IBM Acquisition and Enterprise Uncertainty

Then came June 2024. IBM acquired HashiCorp for 6.4 billion dollars. I need to be careful here because I’m not interested in speculation, but facts are facts. Enterprise customers began asking pointed questions about Terraform’s trajectory under a company whose core business is very different from HashiCorp’s infrastructure automation focus. IBM’s subsequent communications about Terraform’s roadmap introduced exactly the kind of uncertainty that the Pulumi 2025 survey later quantified: 41% of platform engineers cited IaC tool licensing and governance uncertainty as a top-three risk factor in their 2025 and 2026 planning decisions.

This is the part that keeps infrastructure teams awake at night. It’s not theoretical. When your infrastructure-as-code tool lives inside a 6.4 billion dollar acquisition, the calculus changes. What happens in three years when the quarterly targets shift? I’ve seen enough acquisitions to know this is a legitimate concern, not paranoia.

The Migration Numbers Tell Their Own Story

By early 2026, OpenTofu’s provider registry had mirrored over 2,000 providers. The GitHub repository crossed 23,000 stars. These are not vanity metrics. The provider mirror milestone means you can actually use OpenTofu for most real-world infrastructure problems. Terraform has an ecosystem advantage, but OpenTofu has closed that gap enough to matter for the majority of deployments.

A Spacelift survey conducted in 2025 found that 34% of infrastructure teams actively evaluating OpenTofu had completed a full migration from Terraform. Another 28% reported partial migrations in progress. That’s 62% of evaluating teams who have moved at least some workloads. These aren’t small numbers, and they’re not coming from bleeding-edge early adopters anymore. These are teams making deliberate choices based on concrete factors.

The Pulumi State of Cloud Infrastructure 2025 report adds useful context. Teams are diversifying their IaC investments specifically because of licensing uncertainty. When 41% of platform engineers cite governance and licensing as top risks, it’s not a marginal concern. It’s a central planning factor.

Making the Call in 2026

So where does this leave you if you’re trying to make a decision today? Honestly, it depends on your specific constraints in ways that would have been unthinkable in 2023. If you have deep investment in Terraform, vendor lock-in considerations are real, but so is stability. The tool still works. It will continue to work. HashiCorp, now under IBM, isn’t going to let Terraform collapse. But you should go into that choice with eyes open about the licensing model and governance questions.

If you’re starting something new or evaluating migrations, OpenTofu is a genuine alternative that has matured past the fork stage. The feature parity question is mostly settled now. The ecosystem is solid. The governance is transparent. The community velocity is real. The decision is no longer obvious, which is exactly what you should expect from a fork that actually mattered.

The irony is that HashiCorp’s license change inadvertently did something useful for the infrastructure community. It forced a conversation about tool governance that should have happened earlier, and created real incentives for an alternative that has turned into something legitimate. If you haven’t looked seriously at OpenTofu since 2023 or 2024, the project that exists in early 2026 is worth your time.

Start Here: Building Your FinOps Practice Without Breaking Anything

The Quiet Crisis in Your Cloud Bill

About a third of what you’re spending on cloud infrastructure right now is waste. Not inefficiency. Not poor planning. Waste. The number sits around 32 percent of total cloud spend in 2025, and it’s not getting better on its own. The uncomfortable truth is that this waste persists not because the cloud providers are hiding costs from us, but because most organizations treat cloud spending like a utility bill. You pay it. You might glance at it. Then you move on.

Start Here: Building Your FinOps Practice Without Breaking Anything

What changed in the last few years is that this problem stopped being abstract. The FinOps Foundation membership has grown 200 percent in two years. That’s not a trend. That’s organizations waking up to the fact that cloud cost optimization requires the same discipline, tooling, and cross-functional collaboration they apply to security or reliability. The problem is that most teams starting this journey have no idea where to begin.

Illustration for Start Here: Building Your FinOps Practice Without Breaking Anything

Understanding FinOps Maturity Before You Buy Tools

Here’s what I’ve learned from watching teams succeed and fail at cost optimization: buying the fanciest FinOps platform before you understand your own spending patterns is like buying a race car before you’ve learned to drive. You’ll spend money faster, but you won’t get where you need to go.

FinOps maturity has three recognizable stages. In the crawl phase, you’re establishing visibility. You’re learning what you’re paying for, where the money goes, and who owns what. This is uncomfortable because the answers are often messy. You’ll discover resources running in accounts nobody remembers creating. You’ll find duplicate databases that existed because one team didn’t know another team had already built the same thing. Visibility is the only goal here. Resist the urge to optimize prematurely.

The walk phase is where you start building accountability. You connect spending back to teams, projects, and business units. You establish tagging standards. You build forecasts. You create feedback loops so the engineers building systems see the cost implications of their decisions in real time. This phase requires process work and cultural change, not just technical implementation.

The run phase is where continuous optimization becomes a normal part of operations. Reserved instances and savings plans are deployed strategically. Rightsizing decisions happen regularly. Multi-cloud strategies get evaluated not just on capability but on cost impact. Most organizations underestimate how long it takes to reach true maturity here.

Your First Three Weeks: What Actually Matters

Let’s talk about what you should do immediately. Not eventually. Not when you have budget for a consultant. Now.

Start by getting granular cost visibility. If you’re on AWS, spend a full working day understanding AWS Cost Explorer. Configure it to show you spend by service, by linked account, and by tag. If you’re multi-cloud, make sure you have equivalent dashboards in Azure and Google Cloud. Most teams skip this step because it feels elementary. Don’t. You cannot optimize what you cannot see.

Second, establish a baseline and create a forecast. Multiply your average monthly spend by 12 and add 15 percent for growth. That’s your baseline. Your goal over the next quarter is to reduce that forecast number by 10 percent without cutting features or reliability. Write that number down. Share it with leadership. Make it real.

Third, audit your commitment discounts. Reserved instances and savings plans can reduce your bills by 40 to 60 percent for predictable workloads. Most organizations leave this money on the table. If you’re running databases, application servers, or any long-running infrastructure, reserved instances are not optional. They’re the low-hanging fruit that pays for the entire FinOps effort. Start with compute, then storage, then databases. Three items. Three quick wins.

Beyond Commitments: Where Modern Optimization Lives

Once you’ve secured the foundation with commitment discounts, the real work begins. This is where you stop thinking about static purchasing and start thinking about workload-specific optimization.

Spot and preemptible instances now power the majority of machine learning training workloads because teams have learned to use them intelligently. These instances cost 70 to 90 percent less than on-demand pricing, but they can be interrupted. That’s fine for workloads like model training, distributed batch jobs, or non-critical batch processing. The key insight is matching instance type to workload characteristics, not just picking the cheapest option.

Serverless compute is quietly eliminating an entire category of waste: idle resources. If you have event-driven workloads, serverless functions (Lambda, Cloud Functions, Cloud Run) mean you only pay for execution time. No servers running 24/7 waiting for traffic that never comes. Teams that migrate legacy batch jobs to serverless often see immediate 60 to 70 percent reductions in compute costs for those specific workloads.

Multi-cloud strategies are becoming more common, and with that comes operational complexity that directly impacts cost. When you’re managing resources across AWS, Azure, and Google Cloud, you lose economies of scale in commitment discounts. You also lose the ability to build deep relationships with any single provider’s optimization tools. The organizations handling this best treat each cloud as a specialized workload destination rather than a free-for-all. If you’re considering multi-cloud, understand that cost complexity goes up significantly. Make sure the business benefit justifies it.

Building the Practice That Sticks

The difference between teams that see lasting cost reduction and teams that save 10 percent once then watch spending climb back is cultural. FinOps works when engineering, finance, and product teams all see cloud cost as part of the equation.

Create a monthly cost review meeting where your infrastructure team walks through what changed, what was optimized, and what should be investigated next. Keep it to 45 minutes. Invite someone from finance and someone from product. This meeting is where optimization becomes a shared responsibility instead of a burden on the infrastructure team alone.

Document your decisions. When you choose not to implement a reserved instance because you expect a workload to be deprecated in six months, write that down. When you migrate a batch job to spot instances and it fails once, understand why and adjust. FinOps is not about eliminating all risk. It’s about making intentional trade-offs with full information.

The hardest part of this work is that there’s no finish line. Cloud providers update their pricing monthly. Your workloads change. New instance types become available. The practice you build today needs to accommodate that ongoing change without becoming exhausting. That’s why starting small and building incrementally matters more than running a massive optimization project once a year.

If this resonates with your current situation, I’d genuinely like to hear about the specific challenges you’re hitting. What does your cost visibility look like right now? Where does your spending surprise you the most? The patterns I’m seeing vary significantly between organizations, and understanding your constraints would help me write about the problems that actually matter to people in the trenches.

Anthropic’s Model Context Protocol Is Quietly Becoming the USB-C of AI Tool Integration

The Problem Nobody Wanted to Admit Out Loud

For the last couple of years, I’ve watched teams struggle with the same architectural problem, though few seemed willing to name it directly. When you wanted an AI model to interact with your systems—a codebase, a database, internal documentation—you ended up writing custom integration code. Lots of it. Each model had different expectations. Each tool wanted a different shape of data. You’d end up with what I’d call “glue code sprawl,” where half your engineering effort went into translation layers instead of actual functionality.

Anthropic's Model Context Protocol Is Quietly Becoming the USB-C of AI Tool Integration
Anthropic’s Model Context Protocol Is Quietly Becoming the USB-C of AI Tool Integration

The frustration was real because the problem was avoidable. We weren’t dealing with physics constraints or algorithmic impossibilities. We were dealing with poor standardization, the kind that slows down an entire ecosystem for years because nobody wanted to take the first major step toward compatibility.

Then Anthropic released something that, on the surface, looked like a straightforward protocol. I didn’t immediately recognize what it actually was: the moment an industry standard began to form.

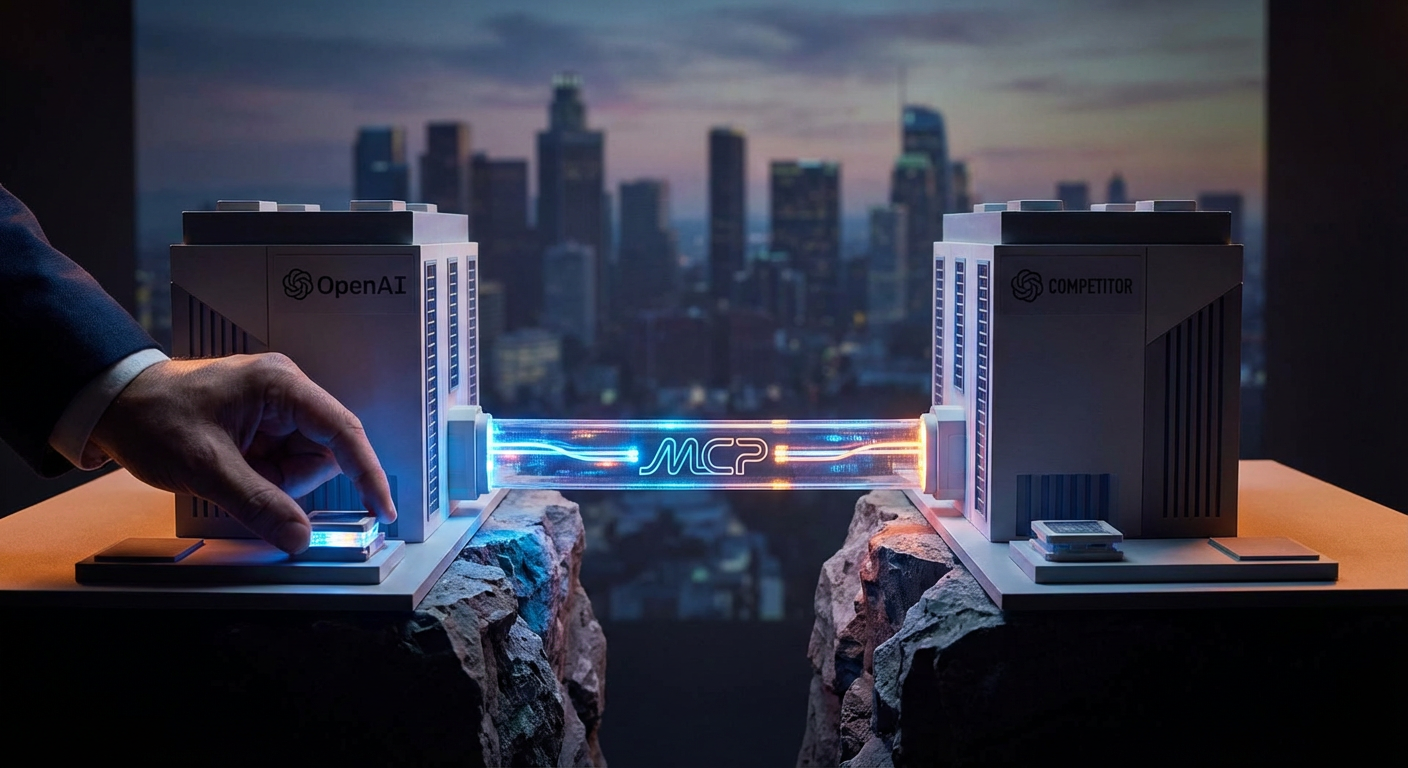
Illustration for Anthropic's Model Context Protocol Is Quietly Becoming the USB-C of AI Tool Integration
Illustration for Anthropic’s Model Context Protocol Is Quietly Becoming the USB-C of AI Tool Integration

The November 2024 Release and What Actually Happened

When Anthropic open-sourced the Model Context Protocol in November 2024, the announcement didn’t cause a sudden market shift. That’s not how infrastructure adoption works. Instead, it was the kind of release that gets a thoughtful nod from engineers who recognize good engineering when they see it. But the adoption curve that followed suggested something else was happening beneath the surface.

By early 2026, you could already see MCP support in Cursor, Zed, Replit, and across the JetBrains IDE ecosystem. That’s not the velocity of a niche protocol. That’s the velocity of something that solved a real problem in a way that actually made sense. The MCP GitHub repository accumulated over 28,000 stars, with hundreds of community-built server implementations covering the ground you’d expect: databases, APIs, file systems, and developer tools. The ecosystem was building itself.

What struck me most, though, was what happened next. OpenAI announced in early 2026 that it would add MCP support to its API and Agents SDK. Let that sink in for a moment. Your direct competitor’s protocol is good enough that you’re adopting it. That’s not something companies do casually. That’s a signal that the market has already decided.

How the Architecture Actually Works

To understand why MCP gained traction so quickly, you need to understand what it actually does. The protocol runs on a client-server architecture where AI models act as clients consuming structured context from local or remote servers. That’s the clean description. Here’s what it means in practice: instead of your application managing the messy details of how to connect Claude to your PostgreSQL instance or your GitHub repo, you define a server that knows how to speak MCP, and the protocol handles the rest.

This eliminates the custom API glue code that used to fill agentic workflows. I’ve written plenty of that glue code myself, and I can tell you it’s one of the least satisfying parts of the job. It’s necessary boilerplate, often fragile, and it needs rewriting every time you want to add a new data source or change how an agent accesses information. MCP standardizes that interaction pattern. It makes the glue generic instead of custom.

The Anthropic Model Context Protocol documentation lays out the specifics, but the core insight is simple: define your resources, define your tools, define how to access them. The protocol handles the serialization and the conversation flow. Your job shrinks considerably.

Enterprise Adoption and the Real Signal

Early adopters matter, but enterprise adopters matter more when you’re evaluating whether something is infrastructure or just a nice tool. Block, formerly Square, and Apollo were among the organizations Anthropic cited as early adopters. These aren’t companies that experiment with every new protocol. They’re companies that make deliberate choices about standards because they need to integrate across large, complex systems.

Block used MCP to connect Claude-based agents directly to internal codebases and documentation systems. That’s the exact problem space where I would have expected bespoke solutions for the next five years. Instead, Block standardized on an open protocol. Apollo did something similar. When enterprises start doing that, you know something has shifted in how we think about interoperability.

This is the pattern I learned to watch for during years of infrastructure work: when adoption jumps from “early adopters experimenting” to “enterprises standardizing on this,” you’re looking at something that’s likely to outlast the moment. MCP has already crossed that threshold.

The USB-C Comparison Actually Holds Up

I was skeptical of the USB-C comparison at first, but the more I think about it, the more apt it is. USB-C succeeded not because it was technically perfect—it wasn’t—but because it solved a coordination problem that was costing everyone time and resources. Before USB-C, you had fragmentation, incompatibility, and endless custom adapters. After, you had a single port that worked across devices and manufacturers.

MCP is doing the same thing for AI model integration. It’s not perfect. No protocol is. But it solved the fragmentation problem that was costing teams engineering effort and slowing down agentic development. Competitors recognized it as valid enough to adopt. And most importantly, the ecosystem voted with its feet.

The fact that we’re only in early 2026 and this level of adoption is already visible suggests we’re looking at something that will shape how AI tools integrate with each other and with business systems for the next several years. That’s not a prediction I make lightly.

If you’re building AI agents or integrating models with your systems, spend time understanding how MCP works and where it fits into your architecture. The infrastructure layer matters, and this one is solidifying faster than most. Have you implemented MCP yet, or are you still working through the traditional glue code approach? I’d be interested in hearing what you’re seeing on your end.

/* ===== EBN Redesign: advanceddotnetdebugging.com ===== */
/* Direction: Precision & Clarity | Foundation: Neutral (zinc) | Depth: flat-surface */

:root {
--ebn-foreground: #18181b;
--ebn-secondary: #52525b;
--ebn-muted: #a1a1aa;
--ebn-faint: #e4e4e7;
--ebn-accent: #6366f1;
--ebn-accent-hover: #4f46e5;
--ebn-bg_canvas: #fafafa;
--ebn-bg_surface: #ffffff;
--ebn-bg_surface_alt: #f4f4f5;
--ebn-border: #d4d4d8;
--ebn-border_light: #e4e4e7;
--ebn-radius: 8px;
--ebn-radius_sm: 4px;
--ebn-radius_lg: 12px;
--ebn-shadow: 0 1px 3px rgba(24,24,27,0.06);
--ebn-shadow_md: 0 4px 16px rgba(24,24,27,0.08);
--ebn-font_display: 'SF Mono', 'Fira Code', 'JetBrains Mono', monospace;
--ebn-font_body: -apple-system, 'Segoe UI', system-ui, sans-serif;
--ebn-font_mono: 'SF Mono', 'Fira Code', monospace;
}

/* ===== Global Reset ===== */
body {
background-color: var(--ebn-bg_canvas);
color: var(--ebn-foreground);
font-family: var(--ebn-font_body);
line-height: 1.7;
-webkit-font-smoothing: antialiased;
}

/* ===== Site Container ===== */
.site,
#page,
.hfeed,
.wrapper {
background-color: var(--ebn-bg_surface);
border-radius: var(--ebn-radius_lg);
box-shadow: var(--ebn-shadow_md);
max-width: 960px;
margin: 2rem auto;
padding: 2rem;
overflow: hidden;
}

/* ===== Typography ===== */
h1, h2, h3, h4, h5, h6,
.entry-title, .page-title, .site-title,
.widget-title, .comments-title {
color: var(--ebn-foreground);
font-family: var(--ebn-font_display);
font-weight: 700;
line-height: 1.25;
letter-spacing: -0.01em;
}

h1, .entry-title {
font-size: 2rem;
margin-bottom: 0.75rem;
}

h2 {
font-size: 1.5rem;
margin-bottom: 0.625rem;
}

h3 {
font-size: 1.25rem;
margin-bottom: 0.5rem;
}

p {
margin-bottom: 1.25rem;
color: var(--ebn-secondary);
}

a {
color: var(--ebn-accent);
text-decoration: none;
transition: color 0.2s ease, text-decoration 0.2s ease;
}

a:hover {
color: var(--ebn-accent-hover);
text-decoration: underline;
}

/* ===== Header ===== */
.site-header,
#masthead,
header {
background-color: var(--ebn-bg_surface);
border-bottom: 2px solid var(--ebn-border_light);
padding: 1.5rem 0;
margin-bottom: 2rem;
}

.site-title a,
.site-title {
font-family: var(--ebn-font_display);
font-size: 1.75rem;
font-weight: 700;
color: var(--ebn-foreground);
}

.site-description {
color: var(--ebn-muted);
font-size: 0.9rem;
font-style: italic;
}

/* ===== Navigation ===== */
.main-navigation,
nav.main-navigation {
background-color: var(--ebn-bg_surface_alt);
border-radius: var(--ebn-radius);
padding: 0.5rem 1rem;
margin: 1rem 0;
}

.main-navigation a,
nav a {
color: var(--ebn-secondary);
font-weight: 500;
padding: 0.5rem 0.75rem;
border-radius: var(--ebn-radius_sm);
transition: background-color 0.2s, color 0.2s;
}

.main-navigation a:hover,
nav a:hover {
background-color: var(--ebn-faint);
color: var(--ebn-accent);
}

.main-navigation .current_page_item > a {
color: var(--ebn-accent);
font-weight: 700;
}

/* ===== Content Area ===== */
.site-content,
#content,
.hfeed {
background-color: var(--ebn-bg_surface);
}

.entry-content,
article .entry-content {
font-size: 1.05rem;
line-height: 1.8;
color: var(--ebn-secondary);
}

.entry-content p {
margin-bottom: 1.25rem;
}

/* ===== Post Cards ===== */
article.post,
article.page,
.hentry {
background-color: var(--ebn-bg_surface);
border: 1px solid var(--ebn-border_light);
border-radius: var(--ebn-radius);
padding: 1.5rem;
margin-bottom: 2rem;
box-shadow: var(--ebn-shadow);
transition: box-shadow 0.2s ease;
}

article.post:hover,
article.page:hover {
box-shadow: var(--ebn-shadow_md);
}

/* ===== Post Meta ===== */
.entry-meta,
.entry-utility,
.posted-on,
.byline {
color: var(--ebn-muted);
font-size: 0.85rem;
margin-bottom: 0.75rem;
}

.entry-meta a,
.byline a {
color: var(--ebn-accent);
}

/* ===== Read More ===== */
.more-link,
.read-more {
display: inline-block;
margin-top: 1rem;
padding: 0.5rem 1.25rem;
background-color: var(--ebn-accent);
color: #ffffff;
border-radius: var(--ebn-radius);
font-weight: 600;
font-size: 0.9rem;
transition: background-color 0.2s ease, transform 0.1s ease;
}

.more-link:hover,
.read-more:hover {
background-color: var(--ebn-accent-hover);
color: #ffffff;
text-decoration: none;
transform: translateY(-1px);
}

/* ===== Sidebar / Widgets ===== */
.widget-area,
#secondary,
aside {
background-color: var(--ebn-bg_surface_alt);
border-radius: var(--ebn-radius);
padding: 1.5rem;
}

.widget {
background-color: var(--ebn-bg_surface);
border: 1px solid var(--ebn-border_light);
border-radius: var(--ebn-radius);
padding: 1.25rem;
margin-bottom: 1.5rem;
box-shadow: var(--ebn-shadow);
}

.widget-title {
font-size: 1rem;
font-weight: 700;
color: var(--ebn-foreground);
border-bottom: 2px solid var(--ebn-accent);
padding-bottom: 0.5rem;
margin-bottom: 1rem;
}

/* ===== Blockquotes ===== */
blockquote,
.wp-block-quote {
border-left: 4px solid var(--ebn-accent);
background-color: var(--ebn-bg_surface_alt);
padding: 1rem 1.5rem;
margin: 1.5rem 0;
border-radius: 0 var(--ebn-radius_sm) var(--ebn-radius_sm) 0;
font-style: italic;
color: var(--ebn-secondary);
}

blockquote p,
.wp-block-quote p {
margin-bottom: 0;
}

/* ===== Code Blocks ===== */
code,
pre,
.wp-block-code {
background-color: var(--ebn-bg_surface_alt);
border: 1px solid var(--ebn-border_light);
border-radius: var(--ebn-radius_sm);
font-family: var(--ebn-font_mono);
font-size: 0.9rem;
}

pre {
padding: 1rem;
overflow-x: auto;
}

code {
padding: 0.15rem 0.4rem;
}

/* ===== Images ===== */
img,
.wp-block-image img {
border-radius: var(--ebn-radius);
max-width: 100%;
height: auto;
}

.wp-caption,
.wp-block-image {
margin: 1.5rem 0;
}

/* ===== Buttons ===== */
button,
input[type="submit"],
.wp-block-button__link {
background-color: var(--ebn-accent);
color: #ffffff;
border: none;
border-radius: var(--ebn-radius_sm);
padding: 0.625rem 1.5rem;
font-weight: 600;
cursor: pointer;
transition: background-color 0.2s ease, transform 0.1s ease;
}

button:hover,
input[type="submit"]:hover,
.wp-block-button__link:hover {
background-color: var(--ebn-accent-hover);
transform: translateY(-1px);
}

/* ===== Forms ===== */
input[type="text"],
input[type="email"],
input[type="search"],
input[type="url"],
textarea,
select {
border: 1px solid var(--ebn-border);
border-radius: var(--ebn-radius_sm);
padding: 0.5rem 0.75rem;
font-family: var(--ebn-font_body);
font-size: 0.95rem;
background-color: var(--ebn-bg_surface);
color: var(--ebn-foreground);
transition: border-color 0.2s ease, box-shadow 0.2s ease;
}

input:focus,
textarea:focus,
select:focus {
border-color: var(--ebn-accent);
box-shadow: 0 0 0 3px var(--ebn-faint);
outline: none;
}

/* ===== Footer ===== */
.site-footer,
#colophon,
footer {
background-color: var(--ebn-bg_surface_alt);
color: var(--ebn-muted);
border-top: 1px solid var(--ebn-border_light);
padding: 1.5rem;
border-radius: 0 0 var(--ebn-radius_lg) var(--ebn-radius_lg);
font-size: 0.85rem;
text-align: center;
}

.site-footer a {
color: var(--ebn-secondary);
}

.site-footer a:hover {
color: var(--ebn-accent);
}

/* ===== Comments ===== */
.comment,
.comment-body {
background-color: var(--ebn-bg_surface);
border: 1px solid var(--ebn-border_light);
border-radius: var(--ebn-radius);
padding: 1rem 1.25rem;
margin-bottom: 1rem;
}

.comment-author {
font-weight: 700;
color: var(--ebn-foreground);
}

.comment-meta {
font-size: 0.8rem;
color: var(--ebn-muted);
}

/* ===== Pagination ===== */
.nav-links,
.pagination {
display: flex;
gap: 0.5rem;
justify-content: center;
margin: 2rem 0;
}

.nav-links a,
.page-numbers {
display: inline-block;
padding: 0.375rem 0.875rem;
border: 1px solid var(--ebn-border);
border-radius: var(--ebn-radius_sm);
color: var(--ebn-secondary);
font-size: 0.9rem;
transition: all 0.2s ease;
}

.nav-links a:hover,
.page-numbers:hover,
.page-numbers.current {
background-color: var(--ebn-accent);
color: #ffffff;
border-color: var(--ebn-accent);
}

/* ===== Scrollbar (Webkit) ===== */
::-webkit-scrollbar {
width: 8px;
}
::-webkit-scrollbar-track {
background: var(--ebn-bg_canvas);
}
::-webkit-scrollbar-thumb {
background: var(--ebn-border);
border-radius: 4px;
}
::-webkit-scrollbar-thumb:hover {
background: var(--ebn-muted);
}

/* ===== Selection ===== */
::selection {
background-color: var(--ebn-accent);
color: #ffffff;
}

/* ===== Accessibility ===== */
:focus-visible {
outline: 2px solid var(--ebn-accent);
outline-offset: 2px;
}

/* ===== Responsive ===== */
@media (max-width: 768px) {
.site,
#page {
margin: 0;
border-radius: 0;
padding: 1rem;
}

h1, .entry-title {
font-size: 1.5rem;
}

.widget-area {
margin-top: 2rem;
}
}