The State Machine Pattern That Saved Our Distributed System From Chaos

When the Message Queue Became Our Enemy

Three years ago, our payment processing system was drowning in race conditions. Orders would complete successfully but inventory would still show as available. Payments would process twice for the same transaction. Our message queue, which we’d proudly built to handle “eventual consistency,” had become a breeding ground for edge cases that only surfaced during peak traffic.

The problem wasn’t our technology stack. It was our mental model. We were thinking about distributed systems as a collection of services passing messages, when we should have been thinking about them as state machines managing transitions. This shift in perspective led us to discover a pattern that most teams overlook: the Saga pattern with explicit state modeling.

Why Traditional Event Sourcing Falls Short

Event sourcing gets a lot of attention in distributed systems circles, and for good reason. It provides an audit trail, enables replay capabilities, and makes debugging easier. But pure event sourcing has a dirty secret: it pushes complexity into the event handlers. When you have dozens of microservices each maintaining their own event projections, you end up with a web of implicit dependencies that’s nearly impossible to reason about.

Consider a typical e-commerce flow: OrderCreated, PaymentProcessed, InventoryReserved, ShippingScheduled. Each service listens for relevant events and updates its state. But what happens when PaymentProcessed arrives before InventoryReserved? Or when the shipping service is down for maintenance? You need compensation logic, retry mechanisms, and careful ordering guarantees. The cognitive load becomes overwhelming.

The Saga pattern addresses this by making state transitions explicit and centralized. Instead of hoping that distributed event handlers will eventually reach consistency, you model the entire business process as a finite state machine with well-defined transitions and compensation actions.

The Choreography vs Orchestration Decision

Most teams gravitate toward choreographed sagas because they feel more “microservices native.” Each service publishes events when it completes its work, and other services react accordingly. No central coordinator, no single point of failure. It sounds elegant until you try to implement error handling.

We tried choreography first. When our payment service failed after inventory had been reserved, we needed the inventory service to listen for PaymentFailed events and automatically release the reservation. When shipping failed after payment succeeded, we needed compensation logic in both the payment and inventory services. The complexity exploded exponentially with each new service we added to the flow.

Orchestrated sagas, on the other hand, use a central coordinator that explicitly manages the workflow. Yes, it’s another moving part. But it’s also the only place where you need to understand the complete business process. When things go wrong, you have exactly one place to look. Our saga orchestrator became a 400-line state machine that replaced thousands of lines of distributed compensation logic scattered across services.

Implementation Patterns That Actually Work in Production

The devil is in the implementation details. Our saga orchestrator runs as a separate service that persists its state to a database with strong consistency guarantees. Each saga instance gets identified by a correlation ID that flows through all related messages. When a step completes successfully, the orchestrator transitions to the next state and sends the appropriate command. When a step fails, it executes the compensation sequence.

The key insight is treating the orchestrator itself as a stateful service, not just a message router. We use a simple state table with columns for saga_id, current_state, payload, and created_at. State transitions are atomic database operations. This gives us durability, exactly-once processing semantics, and the ability to resume sagas after orchestrator restarts.

For monitoring, we emit metrics at each state transition and maintain a dashboard showing active sagas by state. The longest-running saga in each state becomes an early warning system for service degradation. When payments start taking longer than usual, we see it in our saga metrics before customers start complaining.

The Patterns Hiding in Your Current Architecture

You’re probably already using distributed state machines without realizing it. Every retry policy is a state machine. Every circuit breaker is a state machine. Every deployment pipeline is a state machine. The difference is whether you’re modeling them explicitly or letting them emerge organically from your code.

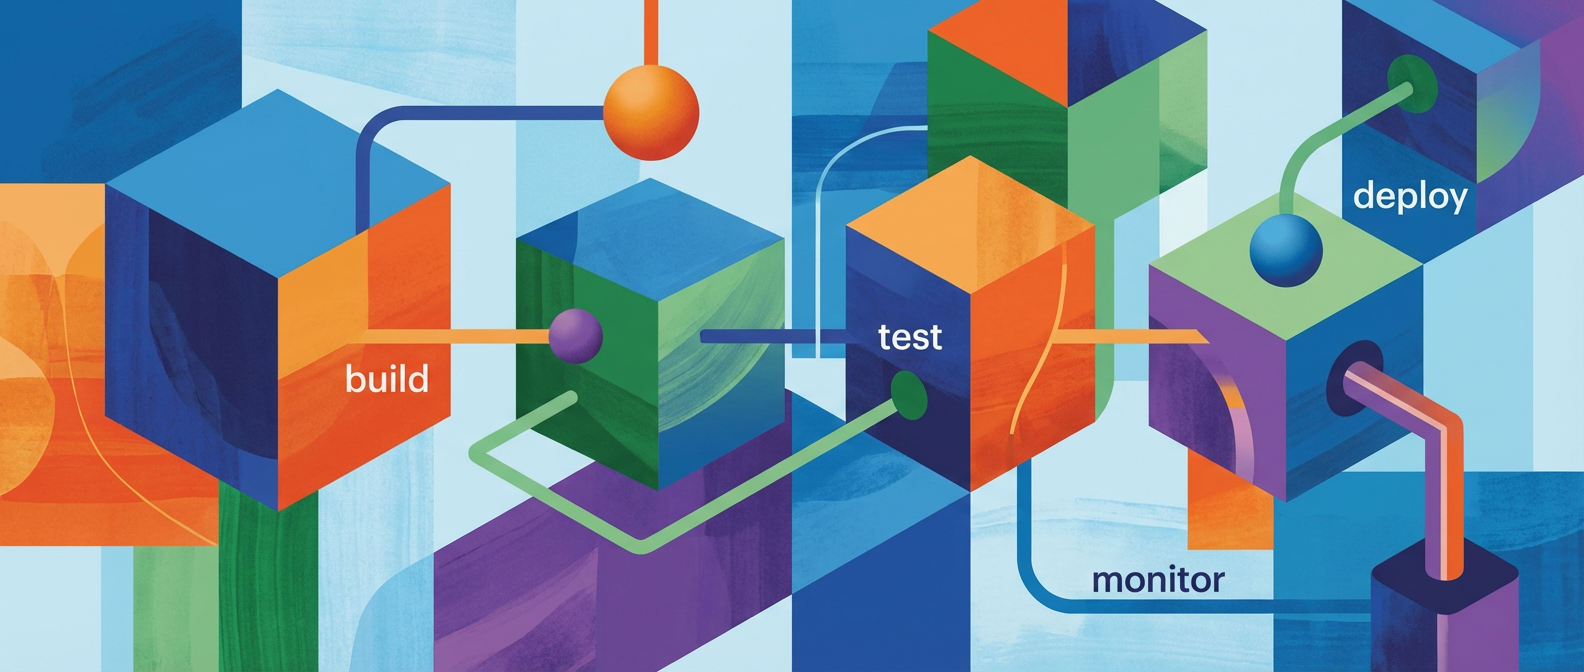
Look at your current error handling. How many places in your codebase have logic that checks “if this fails, then do that, but only if we’re in this particular state”? Those are state transitions waiting to be formalized. The purchase order that can be pending, confirmed, shipped, or cancelled. The user onboarding flow that moves through email verification, profile setup, and initial configuration. The CI/CD pipeline that progresses through build, test, deploy, and verification stages.

Making these state machines explicit doesn’t require a complete rewrite. Start with your most painful distributed workflow. Model its states and transitions on a whiteboard. Identify the current implicit states hiding in your conditional logic. Then gradually migrate toward explicit state management, one transition at a time.

I’m not saying this to add complexity. It’s about making the complexity you already have visible and manageable. Once you start seeing your distributed systems as collections of communicating state machines, patterns that seemed impossible become obvious. And the next time someone suggests eventually consistent event sourcing as the solution to everything, you’ll know when to push back.

The Immutable Laws of CI/CD Pipeline Design: What Twenty Years in Production Has Taught Me

Pipeline Atomicity: The Foundation That Everything Else Depends On

After debugging countless pipeline failures at 3 AM, I’ve learned that the most critical principle in CI/CD design isn’t speed or fancy tooling. It’s atomicity. Every stage in your pipeline must be an atomic operation that either succeeds completely or fails completely, with no partial states lingering to corrupt subsequent runs.

The Immutable Laws of CI/CD Pipeline Design: What Twenty Years in Production Has Taught Me

Think of your pipeline stages like database transactions. When a build stage fails, it shouldn’t leave behind half-compiled artifacts that interfere with the next build. When a deployment fails, it should roll back to the previous known good state, not leave your application in some undefined middle ground. I’ve seen production systems brought down not by the initial failure, but by the inconsistent state left behind when cleanup wasn’t properly designed.

This means designing explicit cleanup phases for every stage. It means proper rollback mechanisms. It means accepting that some operations need to be idempotent by design. Your deployment script should run multiple times against the same environment without causing issues. Your database migrations should handle partial application gracefully. These aren’t nice-to-haves. They’re requirements for a pipeline you can trust when things go wrong.

Illustration for The Immutable Laws of CI/CD Pipeline Design: What Twenty Years in Production Has Taught Me

Fail Fast and Fail Clearly: The Economics of Early Detection

The most expensive bug is the one that makes it to production. The second most expensive? The one that takes forty minutes of pipeline execution to discover. Fast feedback loops aren’t just about developer happiness. They’re about the mathematical certainty that defects caught early cost exponentially less to fix than those caught late.

This principle shows up in how you order your pipeline stages. Static analysis, linting, and unit tests should run before you even consider touching a compiler or building Docker images. Integration tests should run before you spin up expensive cloud resources for staging environments. Each stage should have clear, specific failure modes with actionable error messages. I’ve spent too many hours trying to decipher generic “Build failed” messages to tolerate vague error reporting in any system I design.

But failing fast isn’t just about ordering. It’s about designing tests that actually catch the problems you care about. A test suite that takes thirty seconds but misses critical regressions is worse than a comprehensive suite that takes five minutes. The key is understanding your failure modes and designing your pipeline to catch them as early as possible while maintaining confidence in your safety net.

Environment Parity: Why Production-Like Means Production-Identical

Every environment that code passes through should be functionally identical to production in ways that matter to your application’s behavior. This isn’t about having identical hardware specs. It’s about maintaining consistency in the aspects of the environment that your code actually depends on. Operating system versions, runtime versions, environment variables, network configurations, and external service interfaces should all match between your CI environment and production.

The most insidious bugs only show up under production conditions. I’ve debugged issues where code worked perfectly in development but failed in production because of subtle differences in how different versions of Python handle Unicode encoding. Or how different operating systems manage file permissions. Or how network timeouts behave under load. These aren’t exotic edge cases. They’re predictable consequences of environment drift.

Practically, this means investing in infrastructure as code and treating your CI environment as seriously as you treat production. Your pipeline should run in containers or virtual machines that mirror your production environment as closely as possible. Your test data should reflect the characteristics of production data, including edge cases and malformed inputs. Your external dependencies should be handled consistently across all environments, whether through mocking, service virtualization, or maintained test instances.

Observable Pipelines: Building Systems You Can Actually Debug

A pipeline that works when everything goes right but becomes opaque when things go wrong is worse than useless. It’s actively harmful to your team’s ability to maintain and improve your deployment process. Every stage of your pipeline should emit structured logs, metrics, and artifacts that allow you to understand not just what happened, but why it happened and how long it took.

This observability needs to be designed into the pipeline from the beginning, not bolted on after the first major incident. Each stage should log its inputs, outputs, and any external dependencies it interacts with. Build artifacts should include not just the final deliverable, but also intermediate outputs that can help with debugging. Performance metrics should track not just overall pipeline duration, but the time spent in each stage and any queuing or waiting time between stages.

The goal is to create a system where, when someone wakes you up at 2 AM because the pipeline is broken, you can understand what went wrong without having to reproduce the failure. This means structured logging with consistent formatting, retention policies that keep relevant data available long enough to debug issues, and dashboards that surface the right information to the right people at the right time.

The Principle of Least Surprise: Predictability as a Feature

Your CI/CD pipeline should behave predictably across different inputs, different times of day, and different team members. Pipelines that work differently for different branches, or that behave inconsistently based on external factors like network conditions or time of day, create cognitive overhead that compounds over time and erodes team confidence in the deployment process.

This predictability extends beyond just functional behavior to performance characteristics. A pipeline that usually takes five minutes but occasionally takes forty-five minutes without clear explanation creates uncertainty that affects planning and increases stress during critical deployments. Understanding and controlling the factors that influence pipeline performance is part of designing a system that teams can rely on.

Predictability also means designing clear contracts between different stages of your pipeline and between your pipeline and external systems. If your deployment stage expects certain artifacts from your build stage, those expectations should be explicit and enforced. If your pipeline depends on external services, those dependencies should be clearly documented and monitored.

These principles have served me well across different technologies, different teams, and different organizational contexts. They’re not revolutionary concepts, but they’re the foundation that everything else builds on. If you’ve been wrestling with pipeline reliability issues, or if you’re designing a CI/CD system from scratch, I’d love to hear about your experiences with these principles and how they’ve played out in your specific context.

Infrastructure as Code: Your First Steps Into Automation That Actually Works

Why Infrastructure as Code Matters More Than the Hype Suggests

After watching teams struggle with manual server provisioning for the better part of two decades, I can tell you that Infrastructure as Code isn’t just another buzzword that’ll fade away. It’s the difference between spending your weekend manually rebuilding a crashed production server and having it back online with a single command. The principle is straightforward: treat your infrastructure like you treat your application code, with version control, testing, and automated deployment.

The real value becomes clear when you face your first major outage. I’ve seen teams take eight hours to recreate a complex environment from memory and scattered documentation. With proper IaC, that same environment rebuilds in twenty minutes. But here’s what the tutorials don’t tell you: going from manual provisioning to reliable automation isn’t about learning syntax. It’s about changing how you think about infrastructure entirely.

Start with this mindset: your infrastructure should be disposable. If you can’t delete and recreate any piece of your stack without breaking a sweat, you haven’t reached Infrastructure as Code yet. You’ve just automated some manual steps. This shift in thinking will guide every decision you make as you build your IaC practice.

Choose Your Tool Based on Your Reality, Not Marketing

The tooling landscape feels overwhelming because everyone wants to sell you their solution as the universal answer. After working with Terraform, CloudFormation, Pulumi, and CDK across different organizations, I can tell you there’s no perfect choice. There are only tools that fit your specific situation better than others.

If you’re just starting out and work primarily with AWS, CloudFormation offers the most straightforward path. Yes, the JSON syntax is verbose, but it’s deeply integrated with AWS services and handles dependencies automatically. You’ll spend less time debugging weird edge cases and more time learning the core concepts. Terraform becomes more valuable when you need multi-cloud capabilities or want to manage both infrastructure and application-level resources in the same workflow.

For teams with strong programming backgrounds, Pulumi or CDK can feel more natural because they use familiar programming languages. But here’s the catch: that familiarity can lead you to over-engineer solutions. Infrastructure code should be boring and predictable, not clever. Choose the tool that your entire team can read and modify, not just your most senior engineers.

My recommendation for beginners: start with whatever tool is most common in your organization. You’ll learn faster when you can ask colleagues for help, and you’ll avoid the political complexity of introducing a new tool stack. Master the concepts first, then evaluate alternatives when you understand the problems you’re actually trying to solve.

Start Small and Build Habits That Scale

The biggest mistake I see teams make is trying to codify their entire infrastructure on day one. You’ll burn out, make mistakes, and probably convince yourself that IaC is more trouble than it’s worth. Instead, pick the smallest, most isolated piece of infrastructure you can find and automate that first.

A single S3 bucket with proper lifecycle policies makes an excellent first project. It’s simple enough to understand completely, but complex enough to teach you about resource dependencies, state management, and change detection. Write the code, apply it, modify it, and apply the changes again. Watch how your tool handles updates and deletions. This hands-on experience with state management will save you from painful surprises later.

Once you’re comfortable with basic resources, tackle a simple web server with its security group and load balancer. This introduces you to resource relationships and the importance of proper naming conventions. Don’t worry about making it production-ready yet. Focus on understanding how changes ripple through your stack and how to recover when something goes wrong.

Build your muscle memory around the core workflow: write code, plan changes, review the plan carefully, apply changes, verify the results. This pattern will serve you well when you’re managing hundreds of resources across multiple environments. The tools change, but this cycle stays the same.

Structure Your Code Like You Plan to Sleep at Night

Organization matters more in infrastructure code than in application code because infrastructure mistakes can take down entire systems. I’ve debugged enough 3 AM outages caused by poorly structured IaC to know that a few extra minutes of planning can save you hours of recovery time.

Keep your environments completely separate from the start. Don’t try to share infrastructure code between development and production unless you’re prepared to handle the complexity of parameterization correctly. Separate repositories or separate directory structures both work, but choose one approach and stick with it consistently. I prefer separate directories within the same repository because it keeps related infrastructure changes in the same pull request.

Name your resources predictably and include the environment in the name. A resource called “web-server” becomes “web-server-prod” or “web-server-dev”. This seems obvious until you’re staring at a list of twenty EC2 instances at 2 AM trying to figure out which one runs your production API. Clear naming isn’t just about organization. It’s about operational safety.

Use modules sparingly at first. Modules are powerful for eliminating repetition, but they add abstraction layers that can hide important details. Start by duplicating code between environments until you understand the patterns you’re actually repeating. Then extract modules for the pieces that truly behave identically across environments. A database module makes sense because databases have consistent configuration patterns. A “web tier” module probably doesn’t because web tiers tend to have environment-specific requirements.

Testing and Validation Beyond Syntax Checking

Testing infrastructure code requires a different approach than testing application code. You can’t easily mock AWS APIs or spin up test environments for every change. But you can validate your infrastructure logic before it touches real resources, and you should build this validation into your workflow from the beginning.

Start with the built-in planning tools your platform provides. Terraform’s plan output shows you exactly what changes will be applied before you apply them. Read these plans carefully, especially for production changes. Learn to spot the difference between expected changes and surprising ones. A plan that shows more modifications than you expect usually means you’ve misunderstood something about your tool’s state management.

Add automated validation for the aspects you can check statically. Make sure your security groups don’t allow unrestricted access, verify that your resources follow naming conventions, and check that required tags are present. These validations catch common mistakes before they reach your infrastructure. Tools like TFLint for Terraform or cfn-lint for CloudFormation provide good starting points.

For critical infrastructure, consider setting up a separate testing environment where you can apply changes first. This isn’t always practical for resource-constrained teams, but it’s invaluable for changes that affect networking, security, or data storage. The cost of a testing environment is negligible compared to the cost of a production outage caused by an untested infrastructure change.

Building Confidence Through Small Wins

Infrastructure as Code becomes valuable when it becomes routine. You’ll know you’ve succeeded when deploying infrastructure changes feels as natural as deploying application code. This transformation doesn’t happen overnight, but it’s achievable if you focus on building reliable processes rather than perfect solutions.

Document your decisions as you go, especially the mistakes and their solutions. Infrastructure code often sits untouched for months before someone needs to modify it. Your future self will thank you for explaining why you chose specific resource configurations or why you avoided certain approaches. This documentation becomes the foundation for training new team members and extending your practices to larger parts of your infrastructure.

Remember that every expert was once a beginner who made the same basic mistakes you’re probably making right now. The difference is that they kept iterating, kept learning from failures, and gradually built the judgment that comes from managing real systems over time. Start small, be consistent, and focus on understanding the principles rather than memorizing syntax. The specific tools will evolve, but the core concepts of treating infrastructure as code will serve you throughout your career.

I’d be curious to hear about your own Infrastructure as Code journey. What challenges are you facing as you automate your infrastructure? What tools are working well for your team, and what lessons have you learned the hard way?

The Evolution of Microservices Communication: From REST to Event Streams and Beyond

The Communication Stack We Built on Sand

After fifteen years of architecting distributed systems, I’ve watched microservices communication grow from simple HTTP REST calls into a sprawling mess of protocols, patterns, and platforms. What started as a straightforward replacement for monolithic internal method calls is now one of the trickiest parts of system design. The choices we make here affect everything from latency to how much we hate our on-call shifts.

It all began innocently enough. REST over HTTP seemed obvious in the early 2010s. It was familiar, tooling worked, and debugging was straightforward. But as service counts grew from dozens to hundreds, things started breaking. Network partitions went from theoretical edge cases to daily fire drills. The synchronous nature of REST created cascade failures that could bring down entire service clusters. We learned the hard way that distributed computing has its own cruel set of rules.

The industry’s response? Throw more protocols at the problem. Modern microservices architectures now use a grab bag of approaches: REST for simple request-response patterns, message queues for reliable async processing, and event streaming platforms for real-time data flows. This isn’t complexity for its own sake, though it sure feels like it sometimes. Each protocol handles specific failure modes and performance characteristics that actually matter when you’re dealing with scale.

Event-Driven Architecture: The Signal in the Noise

The biggest shift I’ve seen is everyone moving toward event-driven communication patterns. Where REST treats services like remote function calls, event-driven architectures model services as publishers and subscribers to business events. This isn’t just a technical change. It’s a conceptual one that aligns software architecture more closely with how businesses actually work.

Apache Kafka has won the event streaming war, but the ecosystem around it tells a more interesting story. Tools like Apache Pulsar are gaining ground with their multi-tenant architecture and built-in geo-replication. Newer platforms like Redpanda are rethinking the entire stack for modern hardware. The message is clear: event streaming is becoming infrastructure, not just a messaging pattern.

What I love about this evolution is how event-driven patterns naturally support temporal decoupling. Services can go offline for maintenance, deploys, or failures without losing data or creating blocking dependencies. The system becomes more resilient by design rather than through defensive programming. But let’s be honest about the operational overhead. Event schema evolution, consumer lag monitoring, and message ordering guarantees require sophisticated tooling and deep operational knowledge that many teams don’t have.

gRPC and the Return to Binary Protocols

While everyone was getting excited about events, another quiet revolution was happening with gRPC. Google’s binary protocol initially felt like a step backward from the human-readable JSON over HTTP that had become standard. But after running gRPC in production systems handling millions of requests per day, the performance benefits are hard to argue with.

The code generation aspect of gRPC deserves special mention. Having strongly-typed interfaces between services eliminates entire classes of integration bugs that plague JSON-based APIs. When a service contract changes, compilation fails in dependent services. This might seem restrictive compared to the flexibility of schemaless JSON, but it catches problems at development time rather than at 3 AM when you’re on call.

Recent improvements like gRPC-Web and better HTTP/2 support have solved many of the deployment headaches that initially limited adoption. What started as an internal Google protocol is now seeing widespread use in organizations that care more about performance and type safety than convenience. My prediction: gRPC adoption will accelerate as teams realize that the development velocity gains from strong contracts outweigh the initial learning curve.

GraphQL Federation: Aggregation Meets Distribution

GraphQL represents a different approach to the microservices communication challenge. Rather than optimizing point-to-point communication between services, GraphQL Federation creates a unified query layer above the service mesh. This addresses one of the most persistent problems in microservices architectures: how to efficiently aggregate data from multiple services without creating a brittle orchestration layer.

The federation model allows each service to contribute its schema to a larger graph while maintaining autonomy over its data model and business logic. In practice, this means frontend applications can request exactly the data they need in a single query, while the GraphQL gateway handles the complexity of calling multiple backend services and stitching results together.

GraphQL Federation introduces its own operational headaches, though. Schema composition requires careful coordination between teams. Query performance becomes unpredictable when a single GraphQL query might trigger dozens of downstream service calls. The caching story is more complex than with REST APIs. These aren’t impossible problems, but they require investment in tooling and processes that many organizations underestimate.

The Service Mesh: Infrastructure as Communication Medium

Perhaps the most significant development in microservices communication isn’t a protocol at all, but the emergence of service mesh platforms like Istio, Linkerd, and Consul Connect. These systems move cross-cutting concerns like authentication, encryption, rate limiting, and observability out of application code and into the infrastructure layer.

The promise of service mesh is compelling: polyglot service communication with consistent security and observability policies. The reality is more complicated. Service mesh platforms require significant operational expertise to deploy and maintain. The additional network hops introduce latency. Debugging becomes a nightmare when multiple layers of proxies are involved in every request.

The benefits become apparent at scale, though. Uniform mTLS encryption across all service communication. Circuit breaking and retry policies applied consistently. Distributed tracing that works regardless of the programming language or framework used by individual services. For organizations with hundreds of microservices developed by dozens of teams, service mesh provides governance mechanisms that would be impossible to implement at the application layer.

Looking forward, I expect service mesh adoption to continue growing, particularly in regulated industries where consistent security policies are non-negotiable. My bet: service mesh will become as foundational to microservices architectures as container orchestration platforms like Kubernetes are today. The operational complexity will be hidden by managed offerings from cloud providers, making the benefits accessible to smaller teams.

The future of microservices communication isn’t about picking a single winning protocol or pattern. It’s about understanding the trade-offs deeply enough to make informed decisions for specific use cases. The systems we build today need to be flexible enough to evolve as new patterns emerge, while being operationally manageable with current tooling and team capabilities. What patterns are you seeing in your own microservices architectures? I’d love to hear what’s working and what’s driving you crazy.

The Architecture of Effective Engineering Mentorship: Lessons from Twenty Years of Building Systems and People

The Foundation Layer: Understanding What Mentorship Actually Is

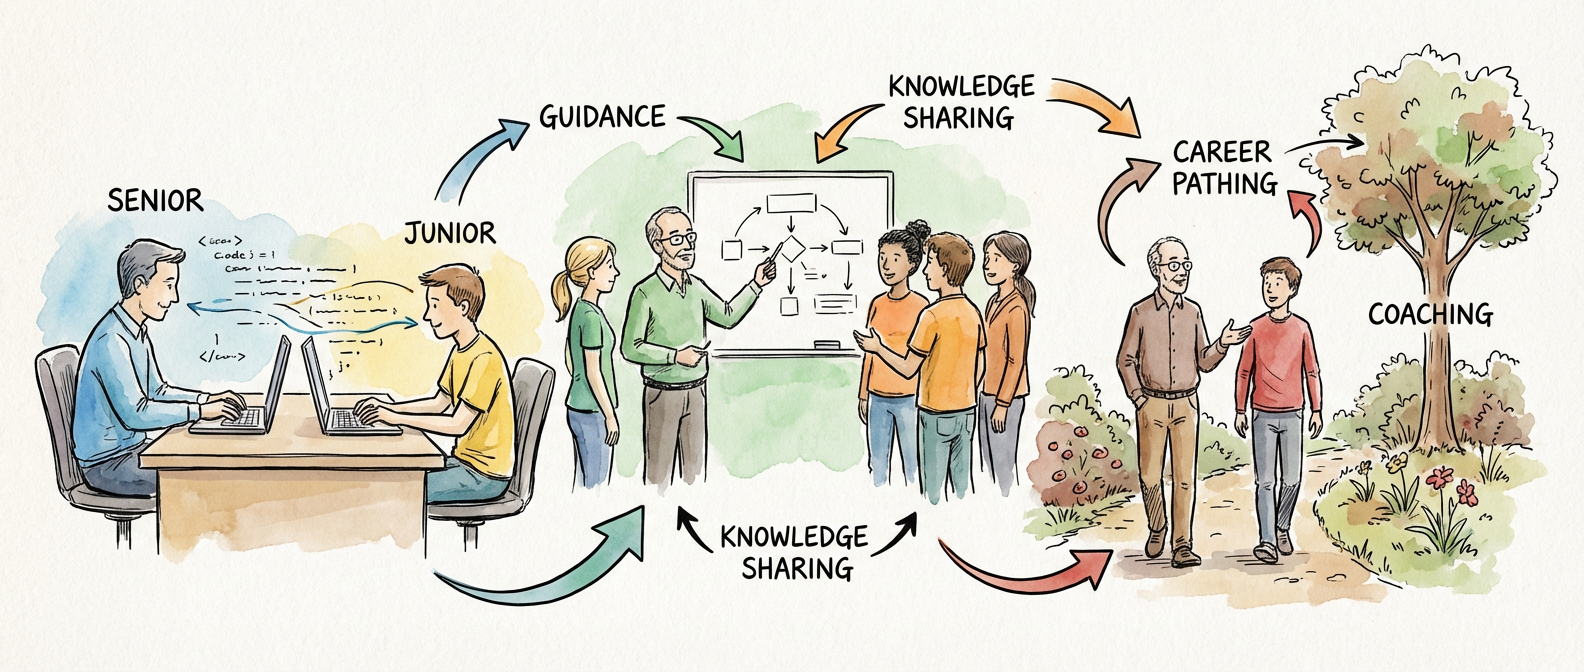
After two decades of building distributed systems and watching countless engineers grow from junior contributors to technical leaders, I’ve learned that most discussions about mentorship miss the fundamental point. Mentorship isn’t about giving advice or sharing war stories over coffee. It’s about creating a structured learning environment where knowledge transfer happens systematically, not accidentally.

The Architecture of Effective Engineering Mentorship: Lessons from Twenty Years of Building Systems and People

The best mentorship relationships I’ve observed work like well-designed APIs. There’s a clear contract, predictable interfaces, and graceful error handling. The mentor provides consistent, reliable guidance while the mentee learns to make increasingly complex requests. Both parties understand the boundaries, expectations, and failure modes. This isn’t about being warm and fuzzy. It’s about being effective.

I’ve seen too many mentorship programs fail because they treat the relationship as purely interpersonal rather than as an engineering problem that requires intentional design. The most successful mentors I know approach the relationship with the same rigor they bring to system architecture. They define success criteria, establish feedback loops, and iterate based on outcomes.

Illustration for The Architecture of Effective Engineering Mentorship: Lessons from Twenty Years of Building Systems and People

The Pairing Protocol: How Knowledge Actually Transfers

Real knowledge transfer happens in the details, not in the abstractions. When I mentor engineers, I spend most of our time looking at actual code, reviewing real design decisions, and walking through specific problems they’re facing. The magic happens when we’re both staring at the same terminal, debugging a race condition or optimizing a query that’s killing the database.

I’ve developed what I call the “three-layer explanation” approach. First, I solve the immediate problem with them. We get the build green, the service responding, or the deployment working. Second, I explain the underlying principles that make the solution work. Why this algorithm, why this data structure, why this architectural pattern. Third, we discuss how this specific solution fits into the broader system design and what trade-offs we’re accepting.

The key insight here is that context switching is expensive for learning, just like it is for processors. When an engineer is stuck on a specific problem, that’s the perfect time to layer in deeper understanding. Their brain is already loaded with the relevant context. They’re motivated to understand because they need to solve the immediate issue. This is when abstract principles become concrete knowledge.

The Feedback Loop: Measuring Progress Without Micromanaging

One of the hardest parts of mentorship is knowing when your mentee is ready for more autonomy and when they still need guidance. I’ve learned to think about this in terms of observability. Just like monitoring a production system, you need the right metrics and alerts to understand what’s actually happening.

I track several leading indicators: the quality of questions they’re asking, how they approach problem decomposition, and their ability to reason about system trade-offs. When someone starts asking “What happens if we get a million concurrent users?” instead of “How do I fix this bug?”, that’s a signal they’re thinking at the right level of abstraction. When they can explain why they chose one approach over another, they’re moving from following patterns to understanding principles.

Most mentors either hover too closely or disappear entirely. The right approach is more like building a monitoring dashboard. You set up the instruments to track progress, establish thresholds for when intervention is needed, and then trust the system to work. You’re available for escalation, but you’re not constantly polling for status.

Code reviews become particularly valuable here. They’re not just about catching bugs or enforcing style guidelines. They’re your primary feedback mechanism for understanding how your mentee thinks about problems, what patterns they’re learning, and where they need help.

The Scale-Out Strategy: Building Multiplier Effects

The most effective senior engineers I know don’t just mentor individuals. They build systems that amplify their impact across entire teams and organizations. This means documenting not just what to do, but why certain approaches work and others don’t. It means creating runbooks that capture decision-making processes, not just procedural steps.

I’ve found that the best mentorship artifacts are those that survive the relationship itself. Design documents that explain the reasoning behind architectural choices. Code comments that describe not just what the code does, but why it was written that way. Post-mortem documents that capture not just what went wrong, but what mental models led to the failure.

This approach requires thinking about knowledge as a shared resource that needs to be managed and maintained. Just like technical debt, knowledge debt accumulates over time. Undocumented assumptions become single points of failure. Tribal knowledge creates bus factor problems. Senior engineers who have the most impact treat knowledge sharing as a core engineering responsibility, not an occasional favor.

The Long Game: Developing Technical Judgment

The hardest thing to teach, and the most valuable thing a mentor can provide, is technical judgment. This is the ability to make good decisions under uncertainty, to balance competing trade-offs, and to know when to break the rules you’ve been taught. Technical judgment can’t be transmitted through documentation or lectures. It develops through repeated exposure to decision-making processes and their long-term consequences.

I’ve learned to be very explicit about the reasoning behind my decisions, especially when they might seem counterintuitive. When I choose a simpler solution over a more elegant one, I explain that we’re optimizing for maintainability over performance because our traffic patterns don’t justify the complexity. When I decide to take on technical debt to meet a deadline, I explain exactly what we’re trading off and how we’ll pay it down later.

The goal isn’t to create mini-versions of myself. It’s to help engineers develop their own judgment frameworks. They need to understand not just my solutions, but how I arrived at them. What information I considered, what constraints I was working within, and what assumptions I was making about the future.

The engineers who’ve benefited most from my mentorship are those who eventually started challenging my decisions and proposing better alternatives. That’s when you know the relationship has succeeded. They’ve learned the principles well enough to apply them in new contexts and extend them in ways you hadn’t considered.

If you’re a senior engineer reading this and recognizing patterns from your own experience, I’d be curious to hear what approaches have worked for you. The best mentorship strategies I know have emerged from practitioners sharing what they’ve learned in the trenches, not from theoretical frameworks. What techniques have you found effective for transferring not just knowledge, but judgment?

The Hard-Won Lessons of CI/CD Pipeline Design: A Career Retrospective

The Foundation: Why Most Pipeline Designs Fail Before They Start

After fifteen years of building, breaking, and rebuilding continuous integration pipelines across companies ranging from scrappy startups to Fortune 500 enterprises, I’ve watched the same fundamental mistakes destroy promising engineering careers and entire product launches. The most common failure isn’t technical debt or tool selection. It’s the absence of clear design principles from day one.

The Hard-Won Lessons of CI/CD Pipeline Design: A Career Retrospective

Most engineers approach CI/CD like they’re assembling a LEGO set without instructions. They grab Jenkins or GitHub Actions, string together a few build steps, and call it done. Six months later, when deployment takes three hours and requires manual intervention at four different checkpoints, they wonder where things went wrong. The answer is always the same: they built a pipeline instead of designing a system.

A well-designed CI/CD pipeline isn’t a collection of scripts that happen to run in sequence. It’s a carefully architected system that reflects your team’s understanding of risk, quality, and delivery velocity. Every decision you make about branching strategy, test execution order, and deployment gates will either compound into operational excellence or spiral into technical debt that takes years to unwind. And trust me, I’ve been on both sides of that equation.

Illustration for The Hard-Won Lessons of CI/CD Pipeline Design: A Career Retrospective

The Three Pillars: Fast Feedback, Reliable Recovery, and Predictable Outcomes

Every successful pipeline I’ve built or inherited operates on three non-negotiable principles. First, fast feedback means your developers know within minutes whether their changes broke something critical. This isn’t just about running tests quickly. It’s about smart test orchestration that runs the highest-risk validations first and fails fast when it matters.

I learned this principle the hard way during a product launch at a fintech company where our test suite took forty-five minutes to complete. Developers would push changes, grab coffee, attend meetings, and completely lose context before seeing results. We were flying blind until someone proposed running our smoke tests and critical path validations in the first five minutes of every build. The psychological impact was immediate: developers started fixing issues within the same focus session instead of context-switching into firefighting mode.

Reliable recovery is where most teams reveal their inexperience. They design for the happy path and panic when things go wrong. Your pipeline must assume failure and make rollbacks as routine as deployments. This means maintaining deployment artifacts, preserving database migration paths, and building health checks that actually detect real problems rather than just confirming your services started successfully.

Predictable outcomes separate professional operations from amateur hour. When your pipeline completes successfully, everyone on your team should understand exactly what changed, where it’s running, and how to validate it’s working correctly. This predictability comes from consistent environments, standardized deployment processes, and monitoring that tells a coherent story about system health.

Environmental Consistency: The Make-or-Break Details

The difference between a senior engineer and someone who’s still learning the ropes often comes down to their relationship with environmental consistency. Junior engineers treat environment differences as annoying edge cases. Senior engineers understand they’re the source of 80% of production incidents and design accordingly.

True environmental consistency goes far deeper than using the same container base image across development, staging, and production. Your database schemas must match exactly. Your feature flags need to be synchronized. External service dependencies should behave identically, and even your monitoring and logging configurations must be consistent. I’ve seen teams spend weeks debugging a production issue that only showed up because their staging environment used a different version of Redis than production. It’s maddening.

The most effective approach I’ve implemented involves treating your pipeline configuration as code that’s versioned alongside your application. This means your build scripts, deployment templates, and infrastructure definitions live in the same repository and evolve together. When someone changes how the application handles database connections, the corresponding infrastructure and deployment changes happen in the same pull request.

Container orchestration platforms like Kubernetes have made environmental consistency more achievable, but they’ve also introduced new categories of configuration drift. Your ingress rules, resource limits, and networking policies must be managed with the same discipline as your application code, or you’ll find yourself debugging phantom issues that only occur in specific environments.

Testing Strategy: Beyond Unit Tests and Integration Theater

Most discussions about CI/CD testing focus on the testing pyramid and call it done, but that’s where real pipeline design begins. The important question isn’t what types of tests to run, but how to sequence them for maximum confidence with minimum waste. Your testing strategy must balance thoroughness with velocity while providing clear signals about what broke and where.

The most effective pipelines I’ve designed use a layered approach that runs fast, focused tests first and progressively expands scope only after earlier layers pass. Start with compilation and static analysis, move to isolated unit tests, then integration tests against real dependencies, and finally end-to-end scenarios in production-like environments. Each layer provides a different type of confidence, and the sequencing ensures you catch expensive problems before burning compute resources on comprehensive test suites.

Contract testing deserves special attention because it solves a problem that many teams don’t realize they have until it’s too late. When your application depends on external APIs or internal microservices, traditional integration tests become brittle and slow. Contract testing lets you validate interface compatibility without standing up entire dependency chains, providing fast feedback about breaking changes while maintaining confidence in system integration.

Security scanning and compliance validation should be woven throughout your pipeline, not bolted on at the end. Dependency vulnerability scanning, code security analysis, and compliance checks that run early in your pipeline prevent security issues from reaching production and eliminate the false urgency of last-minute security reviews that block releases.

Deployment Patterns: Progressive Delivery and Risk Management

The deployment patterns you choose reflect your organization’s risk tolerance and operational maturity. Blue-green deployments, canary releases, and feature flags each solve different problems. Understanding when to use which approach separates experienced practitioners from those following tutorials.

Blue-green deployments work well when you need atomic switches between application versions, particularly for applications with complex state management or long-running processes. I’ve used this pattern effectively for financial systems where partial deployments could create data consistency issues, but it requires maintaining duplicate infrastructure and careful coordination of database migrations.

Canary releases provide the most sophisticated risk management by gradually exposing new versions to increasing traffic percentages while monitoring key metrics. The implementation complexity is higher, requiring robust monitoring, automated rollback triggers, and careful traffic splitting, but the risk reduction is substantial. I’ve seen canary deployments catch performance regressions that passed all pre-production testing by revealing issues that only show up under real user load patterns.

Feature flags represent the evolution of deployment thinking from shipping code to shipping capabilities. When properly implemented, they decouple deployment from release, allowing you to deploy continuously while controlling feature exposure through configuration. This approach requires additional application complexity but provides unmatched flexibility for managing risk and coordinating product launches across multiple teams.

The choice between these patterns depends on your specific constraints, but the best systems I’ve built combine multiple approaches. Use blue-green for infrastructure changes, canary for application updates, and feature flags for new capabilities. This layered approach provides multiple safety nets and different risk management tools for different types of changes.

Building CI/CD pipelines that scale with your organization and survive contact with real-world complexity requires understanding these principles deeply, not just implementing them on the surface. Every choice you make today about testing strategy, deployment patterns, and environmental consistency will either accelerate your team’s delivery capability or become technical debt that slows you down for years. What specific challenges are you facing in your current pipeline design that these principles might help address?

The Hidden $200 Million Problem: What Two Years of FinOps Implementation Taught Me

The Moment Everything Changed

The Slack message arrived at 2:47 AM on a Tuesday. Our cloud bill had jumped 340% overnight, and nobody could explain why. As the newly appointed head of cloud financial operations at a rapidly scaling fintech company, I found myself staring at a $87,000 monthly AWS charge that should have been closer to $25,000. That moment started my crash course into FinOps, and what I discovered over the following two years completely changed how I think about cloud economics.

The Hidden $200 Million Problem: What Two Years of FinOps Implementation Taught Me

The problem was bigger than just our company. Industry analysts now estimate that organizations waste about one-third of their total cloud spending, with projections suggesting this inefficiency will continue well into 2025. When you consider that global cloud spending exceeds $500 billion annually, we’re looking at roughly $160 billion in pure waste. This isn’t just a financial issue, it’s an operational crisis hiding in plain sight.

Building FinOps Muscle in a Growing Organization

The FinOps Foundation became our north star during those chaotic early months. The foundation’s membership has tripled over the past two years, reflecting how desperately organizations need to get their cloud costs under control. But joining a community and implementing effective practices are entirely different challenges, as we learned through trial and considerable error.

Our first breakthrough came from understanding that FinOps isn’t just about cutting costs. It’s about building a culture where engineering, finance, and operations teams share accountability for cloud spending decisions. This required restructuring how we approached everything from architecture reviews to performance monitoring. The engineering team initially resisted having “finance people” involved in technical decisions, but they quickly realized that cost optimization often led to better system design.

We started small, focusing on the most obvious wins. Reserved instances and savings plans became our first major initiative, ultimately reducing our baseline compute costs by 45%. The math is compelling: organizations typically see 40% to 60% cost reductions when they properly implement these commitment-based pricing models. However, the real challenge is accurately forecasting usage patterns and maintaining the discipline to honor those commitments as business requirements evolve.

The Unexpected Complexity of Multi-Cloud Economics

Eighteen months into our FinOps journey, leadership decided to adopt a multi-cloud strategy. The reasoning was sound: avoid vendor lock-in, leverage best-of-breed services, and improve negotiating position. The reality proved far more complex than anyone anticipated. Each cloud provider has different pricing models, discount structures, and optimization tools. What worked brilliantly on AWS required complete rethinking on Google Cloud Platform.

Multi-cloud adoption has become increasingly common, driven by both strategic considerations and the natural evolution of merger and acquisition activity. Companies inherit different cloud environments and often lack the resources or justification to consolidate everything onto a single platform. However, this approach multiplies operational complexity exponentially. We found ourselves managing three different cost optimization strategies, each requiring specialized knowledge and tooling.

The machine learning team provided an interesting case study in this complexity. They had been using spot instances and preemptible instances for training workloads, achieving remarkable cost savings by running the majority of their compute-intensive tasks on discounted capacity. When we expanded this approach across multiple clouds, the coordination overhead nearly eliminated the financial benefits. Each platform handles interruptions differently, and building workloads that gracefully handle preemption across diverse environments required significant engineering investment.

Serverless Revolution and the New Economics of Idle Time

The most dramatic cost optimization came from an unexpected source: serverless computing. Our event-driven workloads were perfect candidates for functions and managed services, but the migration required rethinking our entire approach to capacity planning. Traditional server-based architectures force you to provision for peak load, leaving substantial idle capacity during normal operations. Serverless eliminates this waste entirely, charging only for actual execution time.

Tools like AWS Cost Explorer became essential for understanding these new cost patterns. Unlike traditional infrastructure, serverless costs correlate directly with business activity rather than infrastructure utilization. This alignment created natural feedback loops between our product team and infrastructure spending, leading to more thoughtful decisions about feature design and user experience.

The transition wasn’t without challenges. Serverless architectures can introduce vendor lock-in more subtly than traditional infrastructure choices. Each cloud provider’s function runtime, API gateway, and event sourcing capabilities work slightly differently, making it difficult to maintain the multi-cloud flexibility that originally motivated our strategy. We learned to focus serverless adoption on workloads where the cost benefits clearly justified potential portability constraints.

The Cultural Shift That Made Everything Possible

After two years of implementing FinOps practices, the most important lesson isn’t technical, it’s cultural. Sustainable cost optimization requires changing how teams think about the relationship between features and infrastructure costs. Engineers need visibility into the financial impact of their architectural decisions. Product managers need to understand the cost implications of user engagement patterns. Finance teams need to grasp the technical constraints that drive spending volatility.

We established monthly “cost retrospectives” where teams review their biggest spending increases and decreases, sharing lessons across the organization. These sessions revealed patterns that pure financial analysis missed. For example, a seemingly minor change in how we handled user session persistence led to a 23% increase in database costs over six months. Only by bringing together engineering context and financial data could we identify and address the root cause.

Our measurement approach evolved beyond simple cost reduction metrics. We started tracking cost per customer, cost per transaction, and cost per feature release. These business-aligned metrics helped leadership understand that effective FinOps isn’t about minimizing spending, it’s about maximizing the business value generated per dollar spent. Some of our most expensive infrastructure investments delivered exceptional returns by enabling new revenue streams or improving customer experience.

Looking back, the midnight crisis that started this journey taught us that cloud cost management isn’t a destination, it’s an ongoing practice that requires constant attention and refinement. Organizations just beginning their FinOps journey should expect the process to reveal as many opportunities for business improvement as pure cost reduction. The real value emerges when financial discipline becomes an integral part of how teams design, build, and operate cloud-native systems.

The Invisible Foundation: How Open Source Software Powers Tomorrow’s Digital Economy

The Hidden Backbone of Digital Civilization

Every time you order coffee through an app, stream a video, or check your bank balance online, you’re seeing open source software in action. Behind those polished interfaces and branded experiences sits a foundation built almost entirely on code that anyone can inspect, modify, and distribute freely. This isn’t developer romanticism—it’s measurable reality that’s changing how we think about tech infrastructure.

The numbers are pretty wild: more than 96 percent of the world’s top one million web servers run on Linux, an operating system developed collaboratively by thousands of volunteers and corporate contributors. The web servers themselves—whether Apache or Nginx—process billions of requests daily, generating trillions in economic activity. PostgreSQL databases store everything from social media posts to financial transactions, basically serving as the memory banks of modern commerce.

This open source dominance is more than just technical preference. It’s a fundamental shift in how critical infrastructure gets built, maintained, and evolved. Unlike proprietary systems controlled by single vendors, open source projects distribute both power and responsibility across global communities. We’re only starting to understand what this means.

The Sustainability Crisis Nobody Talks About

For decades, open source operated on what economists might call an “altruistic subsidy model.” Passionate developers contributed nights and weekends to projects that became essential infrastructure, often receiving nothing more than reputation and personal satisfaction in return. This model produced remarkable software, but it also created a hidden sustainability crisis.

The symptoms are getting impossible to ignore. High-profile maintainer burnout cases have forced major corporations to confront an uncomfortable truth: their billion-dollar platforms depend on code maintained by overworked volunteers. The Open Source Initiative and similar organizations have documented increasing stress levels among project maintainers, many of whom struggle to balance community demands with personal livelihoods.

Corporate response has been swift and substantial. GitHub’s Sponsors program has distributed over thirty million dollars directly to open source maintainers, while companies like Stripe, Shopify, and Salesforce have launched dedicated funding initiatives. These aren’t charity gestures—they’re strategic investments in infrastructure that generates enterprise revenue measured in billions annually.

What I find fascinating is that we’re witnessing the professionalization of open source maintenance. Companies are hiring full-time maintainers, sponsoring documentation efforts, and contributing engineering resources to critical projects. This transformation suggests we’re moving from a volunteer-driven ecosystem to a hybrid model where commercial sustainability meets community governance.

Regulatory Pressures and Liability Questions

The European Union’s Cyber Resilience Act is a seismic shift in how governments view open source software. For the first time, major legislation is placing explicit liability requirements on software distributed freely, even when no commercial transaction occurs. This regulatory framework forces a reckoning with questions the open source community has long deferred.

The technical implications extend beyond compliance checklists. Projects must now implement formal security practices, maintain detailed documentation, and provide clear communication channels for vulnerability reporting. While these requirements align with professional software development practices, they also impose overhead that volunteer maintainers may struggle to meet.

Forward-looking organizations are already adapting. The Linux Foundation has expanded its security audit programs, while platforms like GitHub Open Source have introduced automated security scanning and dependency tracking tools. These developments suggest that regulatory pressure, rather than stifling innovation, may actually accelerate the adoption of security-first development practices.

The liability question also creates opportunities for new business models. We’re likely to see the emergence of open source insurance products, professional maintenance services, and compliance consulting firms. These services will help bridge the gap between community-driven development and enterprise risk management requirements.

The Rust Revolution and Safety-First Computing

Perhaps no development better illustrates open source’s evolutionary capacity than Rust’s integration into safety-critical systems. This programming language, originally developed by Mozilla, is systematically replacing C code in contexts where memory safety bugs can cause system failures or security vulnerabilities. The Linux kernel—arguably the most important piece of software ever written—now includes Rust components, while Amazon Web Services uses Rust for performance-critical infrastructure.

This transition is more than a technical upgrade. It shows how open source communities can identify systemic problems and coordinate solutions across organizational boundaries. Traditional software vendors might require years of internal development and careful market timing to make such fundamental changes. Open source projects can experiment, iterate, and deploy improvements as soon as they’re ready.

The Rust adoption pattern also reveals how modern open source development actually works. Rather than displacing existing systems overnight, Rust is being integrated incrementally into critical codepaths where its safety guarantees provide maximum value. This approach minimizes disruption while maximizing security improvements—a lesson that will inform future infrastructure modernization efforts.

Forecasting the Next Decade of Open Source Infrastructure

Several trends point toward continued expansion of open source influence in critical infrastructure. The sustainability improvements we’re seeing today—professional maintenance, corporate funding, security tooling—will likely become standard practice within five years. Projects that can’t adapt to these professional standards may face competitive pressure from better-funded alternatives.

Regulatory frameworks like the EU Cyber Resilience Act will probably spread to other jurisdictions, creating global standards for software security and maintainer responsibilities. This could accelerate the consolidation of the open source ecosystem around projects with professional governance structures and dedicated security resources.

The technical trajectory points toward memory-safe languages like Rust gaining broader adoption in system programming, while traditional languages like C gradually retreat to specialized niches. This transition will happen over decades rather than years, but the direction seems clear.

Most intriguingly, we’re seeing early experiments with AI-assisted code generation and maintenance. These tools could dramatically reduce the human effort required to maintain large codebases, potentially solving the sustainability crisis through productivity gains rather than just increased funding.

The open source model has already proved superior for building critical infrastructure. The next decade will determine whether it can evolve fast enough to meet the security, regulatory, and sustainability challenges of an increasingly digital economy. The early signals suggest reason for optimism, but vigilance remains essential.