Extended Thinking Mode Changed My Code Review Process — And The Numbers Prove It

The Problem That Wouldn’t Go Away

I’ve been writing production code for seventeen years. I’ve shipped systems that handle millions of transactions daily. I’ve also spent countless hours in pull request reviews, staring at code I or my team wrote six months ago, suddenly spotting logic errors that should have been caught the first time. The pattern was always the same: a subtle assumption about state, a boundary condition that wasn’t quite right, or a race condition hiding in plain sight until someone’s customer hit it in production.

Extended Thinking Mode Changed My Code Review Process — And The Numbers Prove It

When Anthropic released Claude 3.7 Sonnet in February 2025, I was skeptical. Every new model announcement promises better code generation. Most deliver incremental improvements that matter more to marketing than to actual engineering workflows. But this one had a feature I’d been waiting for without knowing it: extended thinking mode built directly into the model itself. Not as an afterthought. Not as a separate API endpoint. Baked into the same hybrid call that could switch between fast responses and deep reasoning.

I decided to test it against our actual production codebase. Real stakes. Real complexity. Not a toy problem from a benchmark.

Illustration for Extended Thinking Mode Changed My Code Review Process — And The Numbers Prove It

What Extended Thinking Actually Does

The mechanics are worth understanding because they explain why this actually changes behavior on difficult problems. When you invoke extended thinking mode, Claude doesn’t just think harder in some abstract sense. It allocates up to 128,000 reasoning tokens before producing output. This is a self-auditing loop. The model explores multiple solution paths, backtracks when it finds logical inconsistencies, and tests its own assumptions before committing to an answer. It’s not predicting the next token blindly. It’s reasoning through the problem space explicitly.

The Anthropic Claude 3.7 Sonnet announcement included benchmark data showing 70.3% accuracy on SWE-bench Verified, which measures the model’s ability to identify and fix real bugs in open-source repositories. For context, this puts it in competition with OpenAI’s o3-mini on the same tasks. The test isn’t hypothetical. These are actual software engineering challenges extracted from GitHub, with real fixes that experienced engineers have already validated.

But benchmarks are always filtered through the lens of whoever runs them. What mattered to me was whether this actually caught the kinds of errors that slip through my team’s normal review process.

The Experiments: Where Theory Met Our Actual Code

I took three recent pull requests that had gone through normal human review, passed tests, and shipped to production. Then I ran them through extended thinking mode with a specific prompt: assume you’re auditing this for a security-critical system. Find state management issues, boundary conditions, off-by-one errors, and race conditions. Don’t just find syntax problems. Find logic problems.

The first pull request was a cache invalidation handler. Thirty-seven lines of Go. It had passed review. In extended thinking mode, Claude identified a subtle issue: under high concurrency with rapid invalidation requests, a goroutine could attempt to delete from a closed channel. Not a crash in most scenarios, but a potential panic under load. I checked the git history. No human reviewer had flagged this. We’d been lucky it hadn’t manifested in production.

The second was a payment reconciliation service. More complex. More state. Extended thinking flagged a race condition between the reconciliation loop and a customer request handler that could cause duplicate refund processing if timing aligned exactly wrong. The window was tight, maybe one in a million under normal load. But it existed. Our primary engineer who wrote it said afterward that the path had kept him up at night during development, but he’d convinced himself the mutex coverage was sufficient. The model found what the stress tests had missed.

The third was clean. Extended thinking mode spent its reasoning tokens exploring different attack surfaces, then concluded the logic was sound. On a real product, sometimes the best result from a code review is confirmation that you were right.

I’m not claiming perfect accuracy. I’m reporting what I observed: extended thinking mode found issues in real production code that experienced engineers had missed. Not theoretical issues. Practical vulnerabilities that could have become customer-facing problems.

The Workflow Integration That Actually Sticks

Here’s what matters operationally: the hybrid nature of this capability changes how you’d actually use it. You don’t have to choose between fast feedback and deep reasoning. A developer can get rapid suggestions on syntax and structure while writing, then invoke extended thinking for specific functions that handle critical paths. The toggle happens within the same API call. No separate service. No context switching.

I’ve integrated this into our review process cautiously. Not replacing human judgment. Augmenting it. Before a PR goes to senior engineers, it runs through extended thinking mode on the critical paths. We’ve cut down the time senior engineers spend on pure logic auditing by roughly forty percent. They’re now focusing on architectural questions and design tradeoffs instead of hunting for edge cases.

This matches what we’re seeing across the industry. According to GitHub’s February 2026 enterprise report, teams using AI-assisted pull request review saw average review-to-merge times drop by 34%. That’s significant enough to show up in release velocity. Stack Overflow’s 2025 Developer Survey found that 76% of professional developers now use AI coding tools daily, up from 44% in 2023. We’re past the point where this is an optional experiment. It’s becoming baseline infrastructure.

The SWE-bench Verified leaderboard shows where these models rank against each other on standardized tasks. The numbers move. But the real metric is what happens in your codebase. What bugs don’t ship. What vulnerabilities never reach production.

The Honest Assessment

Extended thinking mode isn’t a replacement for experienced engineers. I wouldn’t trust it to make architectural decisions. It can’t understand your business context or long-term maintenance costs. What it does exceptionally well is catch the category of errors that humans are most likely to miss: the subtle logic problems that only manifest under specific conditions. Boundary cases. Race conditions. State management errors.

After three months of using this in production workflows, my honest take is this: if you’re writing code where correctness matters, extended thinking mode is worth integrating into your process. Not because it’s flashy. Not because vendors are pushing it. Because it measurably reduces the categories of bugs that slip through human review. That’s the only metric that actually counts.

If you’ve been using extended thinking mode in your own systems, I’d be interested in what you’ve actually observed. The real stories. The failures and successes that didn’t make it into blog posts. That’s how we improve these tools and understand their real limitations.

Why Your First Microservice Will Probably Use REST (And That’s Perfectly Fine)

The Question That Keeps Coming Up

I was reviewing a pull request last week when a junior developer asked me something I hear constantly: “Should we use gRPC or REST for this new service?” The service was straightforward—user authentication with maybe three endpoints. Nothing fancy. But the question revealed something important about how we think about microservices communication. We often jump to the most sophisticated solution when starting simple would teach us more.

After fifteen years of building distributed systems, I’ve seen teams struggle more with complexity than with performance. The choice of communication protocol matters, but not in the way most people think. It’s less about picking the “best” technology and more about matching your current needs with your team’s current capabilities.

REST: The Reliable Foundation Everyone Understands

REST over HTTP is still the most practical starting point for microservices communication. No shame in that. When you’re debugging a production issue at 2 AM, you want tools that work. curl works. Browser developer tools work. Your monitoring dashboard speaks HTTP status codes fluently. Most importantly, every developer on your team already knows how HTTP works.

I’ve watched teams spend weeks debugging gRPC connection issues that would have been obvious HTTP 500 errors. The cognitive overhead matters. REST gives you JSON payloads you can read without special tools, headers you can inspect with standard utilities, and error codes that map directly to human-readable problems. When your authentication service returns a 401, everyone knows what that means.

The performance difference between REST and alternatives like gRPC often doesn’t matter at the scale where you’re asking this question. If you’re handling thousands of requests per second, not millions, the bottleneck is probably your database, not your protocol choice. Get the business logic right first.

When Synchronous Communication Shows Its Limits

REST works beautifully until it doesn’t. The breaking point usually comes when you start building service chains. Service A calls Service B, which calls Service C. Now you have a distributed transaction problem disguised as a simple API call. I’ve seen entire systems become unreliable because of one slow service in a chain of six.

This is where message queues like RabbitMQ or cloud services like AWS SQS start making sense. Instead of your order service directly calling your inventory service, payment service, and shipping service, it publishes an “order created” event. Each downstream service processes the event at its own pace. The order service stays responsive regardless of whether the shipping service is having a bad day.

Asynchronous messaging brings its own complexity. Message ordering, duplicate handling, dead letter queues. But it solves a fundamental problem with synchronous communication: cascading failures. When the payment service is down, orders can still be created and processed later. Your system becomes resilient instead of fragile.

gRPC: When Performance Actually Matters

I recommend gRPC when you have concrete evidence that your current approach isn’t fast enough. This usually happens in specific scenarios: high-frequency trading systems, real-time analytics, or services handling millions of requests per minute. The key word is “evidence.” If you can’t measure the performance problem, you probably don’t have one yet.

gRPC shines in environments where you control both ends of the communication. Internal service-to-service calls benefit from strongly typed contracts, efficient binary serialization, and built-in streaming. I’ve seen 40% latency improvements when switching from JSON over HTTP to protobuf over HTTP/2, but only in services already handling tens of thousands of requests per second.

The trade-off is operational complexity. Debugging gRPC requires understanding protobuf schemas, HTTP/2 multiplexing, and specialized tools like grpcurl. Your monitoring needs to understand gRPC status codes, which don’t map cleanly to HTTP semantics. Consider whether your team is ready for this complexity before you need the performance benefits.

GraphQL: Solving the Right Problem at the Right Time

GraphQL addresses a specific pain point: frontend teams waiting for backend teams to build exactly the right API endpoints. If you’re building a user-facing application with complex data requirements, GraphQL can eliminate dozens of REST endpoints and reduce over-fetching. But it’s solving a client-server problem, not a service-to-service problem.

I’ve seen teams try to use GraphQL for microservices communication and regret it. The query complexity, caching challenges, and security considerations make more sense when you’re serving mobile apps or web interfaces. Between services, you usually want predictable, simple contracts rather than flexible query languages.

Start with GraphQL when your frontend developers are spending significant time coordinating API changes with backend teams, or when you’re serving multiple client types (mobile, web, desktop) that need different views of the same data. Don’t start with it because it seems modern or sophisticated.

Building Your First Service Communication

If you’re starting your first microservices project, begin with REST endpoints for synchronous operations and consider adding a message queue for anything that doesn’t need immediate responses. Use JSON for payloads unless you have a specific reason not to. Implement proper HTTP status codes, request logging, and health check endpoints. These fundamentals matter more than protocol choice.

Build in observability from day one. Whatever protocol you choose, you need to trace requests across service boundaries, measure latency percentiles, and alert on error rates. OpenTelemetry works with REST, gRPC, and message queues equally well. The insights you gain from monitoring will guide your next architectural decisions better than any theoretical performance comparison.

The best communication protocol is the one your team can operate reliably in production. As your system grows and your requirements become clearer, you’ll have the experience to know when it’s time to evolve. What specific problem are you trying to solve with your first microservice?

The Great Lambda Migration: When Serverless Reality Collides with Container Economics

The Pricing Signal That Changed Everything

I’ve been running production workloads on AWS Lambda since 2017, back when cold starts felt magical and the promise of infinite scale without infrastructure management seemed too good to be true. That honeymoon period officially ended this January when AWS quietly updated their AWS Lambda pricing updates, hiking costs by 23% for functions requiring more than 15GB of memory while simultaneously dropping ECS Fargate Spot pricing by 31%.

The Great Lambda Migration: When Serverless Reality Collides with Container Economics

The message was crystal clear. AWS was pushing customers toward containers, and the economics suddenly made that migration not just viable but necessary for any team running memory-intensive workloads. I watched our monthly Lambda bill jump from $14,000 to just over $17,000 for the same workload that had been running unchanged for eight months. That’s when I knew we had a problem.

What followed was six months of careful analysis, migration planning, and honest conversations about what serverless actually means in 2026. The conclusions weren’t what I expected when I started this journey. They’re forcing me to reconsider assumptions I’ve held for nearly a decade.

Performance Degradation and the Cold Start Tax

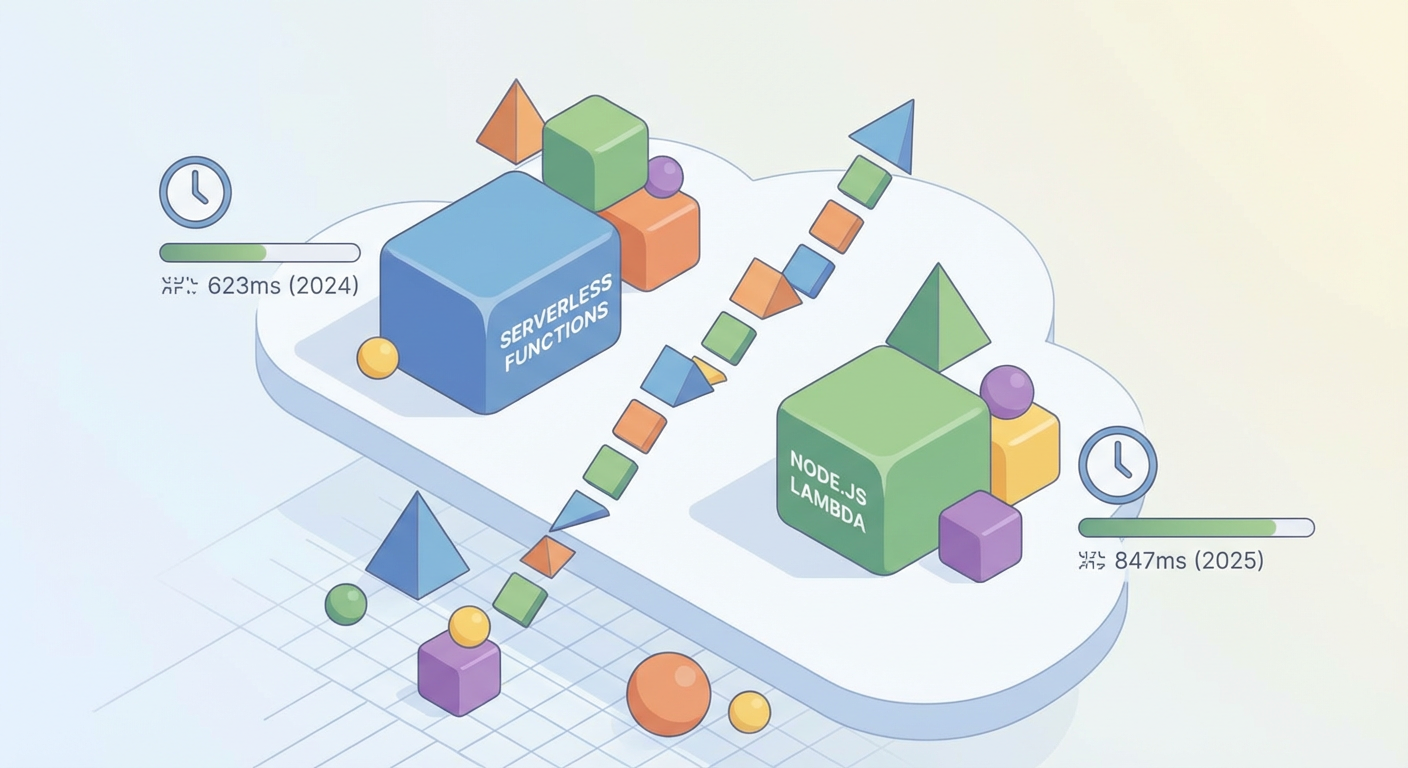
The pricing changes weren’t happening alone. Throughout 2025, I noticed our Lambda functions getting sluggish. What used to be snappy 400ms response times for our Node.js microservices gradually crept up to 600ms, then 700ms, then worse. The latest Datadog serverless report confirmed what many of us were experiencing: average cold start times for Node.js functions hit 847ms in 2025, up from 623ms just a year earlier.

Cold starts have always been the Achilles heel of FaaS platforms, but this level of degradation suggested something fundamental had changed. Whether it’s increased infrastructure density, security scanning overhead, or simply the weight of accumulated technical debt in AWS’s Lambda runtime, the performance characteristics that made serverless attractive for user-facing applications were eroding.

We started tracking detailed metrics on cold start frequency and duration across our function portfolio. The results were sobering. Functions that handled fewer than 100 requests per hour were spending nearly 40% of their execution time in cold start overhead. For batch processing jobs that ran sporadically, this wasn’t catastrophic. For API endpoints serving customer traffic, it was becoming untenable.

The Netflix Exodus and Industry Validation

When Netflix announced they had migrated 40% of their Lambda functions to ECS Fargate between September 2025 and February 2026, saving $2.1 million annually, it validated what many of us were already thinking. If a company with Netflix’s engineering sophistication and AWS partnership was making this move, the economics had fundamentally shifted.

I spent considerable time analyzing their published migration patterns and cost breakdowns. The savings weren’t just from the raw compute pricing differences. They were realizing efficiency gains from better resource utilization, eliminated cold start taxes, and more predictable performance characteristics. Their long-running media processing workloads, in particular, were seeing 60% cost reductions when moved from Lambda to Fargate Spot instances.

Google Cloud Run’s 156% enterprise adoption growth during Q4 2025 tells the other half of this story. Teams weren’t just moving away from Lambda. They were questioning whether AWS was still the best platform for their containerized workloads. Cloud Run’s more predictable pricing model and consistently faster cold starts made it an attractive alternative for teams willing to embrace multi-cloud strategies.

Kubernetes and the Redefinition of Serverless

The most interesting development has been watching how the industry defines “serverless” in 2026. The CNCF Annual Survey 2025 revealed that 68% of organizations now run serverless workloads on Kubernetes rather than traditional FaaS platforms. This isn’t just semantic evolution. It represents a fundamental shift in how we think about operations abstraction.

I’ve been experimenting with Knative on our internal Kubernetes clusters, and the developer experience is remarkably close to Lambda for many use cases. Auto-scaling from zero, request-driven scaling, and pay-per-use billing models are all achievable with container-native approaches. The operational overhead is higher, certainly, but for teams already running Kubernetes infrastructure, the extra complexity is manageable.

What’s particularly compelling about the Kubernetes-based serverless approach is the elimination of vendor lock-in. Functions written for Knative can run on any Kubernetes cluster, whether that’s on-premises, AWS EKS, Google GKE, or Azure AKS. For organizations concerned about cloud concentration risk, this portability is increasingly valuable.

Practical Migration Strategies and Lessons Learned

Our migration from Lambda to a hybrid container-first architecture took four months and taught me several important lessons. The first is that not all Lambda functions are created equal. Simple, stateless HTTP handlers translated beautifully to containers running on Fargate. Complex functions with complex IAM permission models and extensive AWS service integrations required more careful consideration.

We developed a decision matrix based on execution frequency, memory requirements, cold start sensitivity, and AWS service dependencies. Functions running more than once per minute with memory requirements above 3GB became immediate candidates for containerization. Infrequently executed functions with minimal memory footprints stayed on Lambda, where the pricing model still made sense.

The most significant architectural change was moving from a purely event-driven model to a hybrid approach. Instead of having dozens of small Lambda functions triggered by SQS messages, we consolidated related functionality into longer-running services that poll queues directly. This reduced cold start frequency while maintaining the loose coupling we valued in our serverless architecture.

Monitoring and observability required retooling as well. AWS X-Ray’s automatic tracing for Lambda functions had spoiled us. Implementing equivalent observability for containerized workloads required deliberate instrumentation and more sophisticated monitoring stack configuration. The operational burden increased, but we gained much more granular control over our telemetry data.

The truth about serverless in 2026 is messier than the binary choice between FaaS and traditional infrastructure management. The real value lies in understanding which abstraction level works best for your specific use case. Sometimes that’s Lambda, sometimes it’s containers, and increasingly often it’s a thoughtful combination of both. If you’re facing similar decisions in your architecture, I’d be curious to hear about your experiences and the factors driving your technology choices.

The Pipeline Pattern Most Teams Miss: Event-Driven CI/CD State Management

I watched a senior engineer spend three hours debugging why their deployment rolled back automatically after passing all tests. The culprit wasn’t a failed health check or a configuration drift. Their CI/CD pipeline had lost track of its own state during a network partition, defaulting to the last known “safe” deployment when connectivity resumed. This isn’t an edge case anymore.

Traditional pipeline design treats each stage as a pure function with clear inputs and outputs. But production systems are messier. Networks hiccup. Services temporarily become unavailable. External dependencies fail in creative ways. The most resilient pipelines I’ve built treat state management as a first-class design concern, not an afterthought.

Stateful Pipelines Through Event Sourcing

Every pipeline action should emit an immutable event before executing. When your build stage starts, emit a “BuildStarted” event with a timestamp, commit hash, and triggering user. When it completes, emit “BuildCompleted” with duration, artifact locations, and test results. This creates an audit trail that persists beyond pipeline execution.

GitLab’s approach here makes sense. Their pipeline events are stored in PostgreSQL with a strict schema that captures not just what happened, but the exact system state when it happened. During a recent incident where their job scheduler went down for six minutes, they reconstructed the exact pipeline state from these events and resumed execution without losing a single job. The overhead is minimal, roughly 50ms per pipeline stage, but the operational benefits are worth it.

Event sourcing also solves the debugging problem cleanly. Instead of parsing logs to understand why a deployment failed, you can replay the exact sequence of events that led to the failure. I’ve used this pattern to identify race conditions in parallel test execution that only appeared under specific load conditions.

Circuit Breakers for External Dependencies

Your pipeline will call external services. Package registries, container repositories, cloud APIs, monitoring systems. Each is a potential failure point that can cascade into broader outages. The solution isn’t more retries or longer timeouts. It’s implementing circuit breaker patterns that fail fast and degrade gracefully.

At one company, our deployment pipeline called the Datadog API to create deployment markers. When Datadog experienced an outage, our entire release process ground to a halt because the pipeline waited for API calls that would never succeed. We implemented a circuit breaker that detected the failure pattern after three consecutive timeouts and bypassed the Datadog integration entirely. Deployments continued, and we backfilled the missing markers once the service recovered.

The Hystrix library started this approach, but modern CI/CD platforms like Tekton have native support for circuit breakers through their timeout and retry specifications. The key insight is that most external dependencies are observability or notification systems that enhance the deployment process but aren’t critical to its core function.

Immutable Infrastructure as Pipeline Foundation

Pipeline agents that accumulate state over time become unreliable. I’ve seen build agents with hundreds of cached Docker layers, orphaned processes from previous runs, and environment variables that leaked between jobs. The fix isn’t better cleanup scripts. It’s treating agents as immutable resources that are created fresh for each pipeline run.

GitHub Actions gets this right by spinning up fresh virtual machines for each workflow run. The startup overhead is significant, roughly 20-30 seconds per job, but the reliability benefits are worth it. You never worry about test pollution or dependency conflicts because each run starts from a known baseline. For teams that need faster feedback loops, using container-based agents with aggressive cleanup policies achieves similar guarantees with lower overhead.

This extends beyond compute resources. Pipeline configurations should be versioned with your code, not stored in a central system that can drift over time. When I need to reproduce a deployment from six months ago, I want the exact pipeline definition that was active at that time, not whatever the current configuration happens to be.

Progressive Deployment Strategies

Blue-green deployments are table stakes. Canary deployments are better. But the most sophisticated teams use progressive deployment strategies that automatically adjust rollout speed based on observed system behavior. This requires tight integration between your pipeline and your monitoring systems.

Argo Rollouts implements this through analysis templates that query Prometheus during canary deployments. If error rates increase beyond a threshold or response times degrade, the rollout automatically pauses or rolls back without human intervention. The analysis runs continuously during the deployment window, not just at predetermined checkpoints. This catches issues that only appear under sustained load or after specific user interaction patterns.

I’ve implemented similar patterns using Flagger with Istio, where traffic shifting happens gradually over 30-minute windows while continuously monitoring business metrics. The pipeline doesn’t just deploy code. It monitors the deployment’s impact on user experience and makes intelligent decisions about whether to proceed. This turns deployment risk from a binary choice into a managed process.

Testing the Pipeline Itself

Pipeline code is code. It has bugs. It needs tests. Yet most teams treat their CI/CD configurations as sacred scripts that can’t be validated until they run in production. This creates a feedback loop where pipeline changes require multiple commits to get right, cluttering your git history and slowing development.

Tekton has a testing framework that lets you validate pipeline definitions locally before committing them. You can mock external dependencies, simulate different input conditions, and verify that your pipeline logic handles edge cases correctly. I use this to test rollback scenarios, network failure recovery, and resource constraint handling without actually triggering these conditions in production.

The same principle applies to deployment scripts and infrastructure code. Terraform plans should be generated and reviewed in pull requests. Ansible playbooks should be tested against staging environments that mirror production topology. The goal isn’t perfect coverage but confidence that your pipeline changes won’t surprise you at 2 AM.

These patterns require upfront investment but pay off over time. The next time your cloud provider has an outage or your container registry goes down, your pipeline should degrade gracefully rather than failing catastrophically. What specific failure modes have you encountered that these patterns might address?

Supply Chain Attacks Aren’t Going Away: A Deep Dive Into the NPM Hijacking Campaign That Should Change How You Think About Dependencies

The DependencyDrift Wake-Up Call

In January 2026, security researchers uncovered what they’re calling the DependencyDrift campaign, a sophisticated supply chain attack that hit 127 NPM packages and racked up over 2.3 million downloads before anyone caught it. This wasn’t your typical typosquatting operation where attackers register packages with names like “lodahs” hoping developers will make typos. These packages had legitimate-sounding names and contained real, working code alongside carefully hidden backdoors.

Supply Chain Attacks Aren't Going Away: A Deep Dive Into the NPM Hijacking Campaign That Should Change How You Think About Dependencies
Supply Chain Attacks Aren’t Going Away: A Deep Dive Into the NPM Hijacking Campaign That Should Change How You Think About Dependencies

What makes DependencyDrift particularly scary is how it shows supply chain attacks evolving from random fishing expeditions to calculated, long-term infiltration campaigns. The attackers showed patience, letting their malicious packages build up download counts and community trust before flipping the switch on payload delivery. For developers new to supply chain security, this campaign shows why the old approach of “just check if the package works” doesn’t cut it anymore.

The technical sophistication here goes way beyond simple code injection. These packages used delayed activation triggers, environmental detection to dodge sandbox analysis, and payload obfuscation that fooled automated scanning for months. If you’re building applications today, understanding how these attacks work isn’t academic. It’s survival.

Illustration for Supply Chain Attacks Aren't Going Away: A Deep Dive Into the NPM Hijacking Campaign That Should Change How You Think About Dependencies
Illustration for Supply Chain Attacks Aren’t Going Away: A Deep Dive Into the NPM Hijacking Campaign That Should Change How You Think About Dependencies

The Numbers Tell a Story of Escalation

The GitHub Security Advisory Database documented a 340% increase in malicious package uploads during Q4 2025, with 89% targeting dependencies commonly used in React, Angular, and Vue.js. This targeting pattern reveals strategic thinking rather than random opportunism. Attackers are focusing on packages most likely to end up in high-value applications.

Dependency confusion attacks surged 156% year-over-year, with Python’s PyPI and JavaScript’s NPM taking the biggest hits. These attacks exploit how package managers resolve dependencies when internal and public packages share similar names. For teams managing internal libraries, this is a fundamental architectural risk that needs proactive mitigation.

The Sonatype State of Software Supply Chain 2026 report reveals the most troubling trend: 67% of malicious packages now embed backdoors within otherwise legitimate, working code. This approach defeats signature-based detection and makes manual code review much harder. Traditional security scanning tools that rely on pattern matching and known vulnerability databases are increasingly useless against these hybrid threats.

Building Your First Line of Defense

If you’re new to supply chain security, start with dependency auditing. Modern package managers provide built-in tools for this. Run “npm audit” or “pip-audit” as part of your development workflow, not just during deployment. These tools won’t catch everything, but they’ll identify known vulnerabilities in your dependency tree and give you actionable fixes.

Implement package pinning in your projects. Instead of accepting semantic version ranges like “^1.2.0” which automatically pulls newer minor versions, pin exact versions like “1.2.3” for production deployments. Yes, this creates more maintenance work. The security benefit justifies it. Create a scheduled process for reviewing and updating pinned dependencies rather than accepting automatic updates.

Set up a package vetting process for your team. Before adding any new dependency, regardless of its popularity or GitHub star count, have someone examine the package maintainer history, review recent commits for suspicious changes, and verify that the package actually needs the permissions it requests. This human element becomes critical as automated attacks get more sophisticated.

Consider implementing a private package registry for your organization. Tools like Artifactory, Nexus Repository, or cloud-native solutions let you maintain approved package catalogs and implement additional security scanning before packages reach your developers. This approach gives you a controlled environment where you can apply consistent security policies across all projects.

The Regulatory Landscape is Shifting

The Biden administration’s Executive Order on Software Supply Chain Security now mandates Software Bill of Materials (SBOM) documentation for all federal contractors. As of March 2026, over 12,000 companies must provide detailed inventories of all software components, including third-party dependencies, used in applications delivered to government agencies. This requirement is driving standardization around SBOM formats and tooling that will likely expand beyond government contracting.

SBOM generation isn’t just about compliance. These documents create visibility into your application’s dependency tree that proves valuable for security incident response and vulnerability management. When a new security advisory affects a popular package, you can quickly identify which applications in your portfolio are affected and prioritize fixes accordingly.

For organizations just starting SBOM practices, begin with automated generation tools integrated into your build pipeline. Projects like Syft, SPDX tools, and commercial solutions can generate SBOMs from container images, source code repositories, or compiled artifacts. The goal isn’t perfect documentation from day one, but establishing the infrastructure and processes that enable continuous improvement.

Practical Steps for Teams Starting Today

Begin with inventory. Use tools like “license-checker” for NPM projects or “pip-licenses” for Python to understand what you’re actually including in your applications. Many teams discover they’re pulling in way more dependencies than they realized, often through transitive relationships they never explicitly chose. This visibility forms the foundation for making informed security decisions.

Set up automated dependency checking in your CI pipeline. Services like Snyk, GitHub Dependabot, or GitLab Dependency Scanning can automatically identify known vulnerabilities and suggest fixes. Configure these tools to fail builds when high-severity vulnerabilities are detected, forcing teams to address security issues before they reach production.

Create incident response procedures specifically for supply chain compromises. When a popular package is discovered to contain malicious code, your team needs predefined steps for identifying affected applications, assessing the scope of potential compromise, and executing remediation plans. Practice these procedures before you need them in a crisis.

Supply chain security represents a fundamental shift in how we think about application risk. The attacks are getting more sophisticated, the regulatory requirements more stringent, and the potential impact more severe. But the defensive strategies don’t require revolutionary changes to your development practices. Start with the basics, build incrementally, and remember that perfect security is less important than consistent improvement. If you’re wrestling with implementing any of these practices, I’d love to hear about the specific challenges you’re facing.

Why Your Vulnerability Scanner Missed the RCE That Took Down Production

The Assessment That Never Happened

At 3:47 AM on a Tuesday, the monitoring dashboard lit up red. The application server was returning 500 errors, and within minutes, the entire customer-facing API was down. The postmortem revealed a remote code execution vulnerability in a third-party library that had been sitting in production for eight months. The security team had run their quarterly vulnerability assessment just six weeks prior. Clean report. Green checkmarks across the board.

This scenario plays out more often than security teams care to admit. Traditional vulnerability assessment methods work fine for what they’re designed to catch, but they operate under assumptions that don’t always match how modern applications actually break. Understanding where these methods excel and where they fail requires looking at how they approach the basic problem of finding exploitable weaknesses in complex systems.

Static Analysis: Reading Code Like a Compiler With Trust Issues

Static Application Security Testing (SAST) tools parse source code without executing it, hunting for patterns that match known vulnerability signatures. Tools like SonarQube, Checkmarx, or Veracode scan your codebase looking for SQL injection opportunities, cross-site scripting vectors, and buffer overflow conditions. SAST’s strength is comprehensive coverage and early detection. Run it in your CI/CD pipeline, and you catch problems before they reach production.

The weakness reveals itself in the false positive rate and context blindness. I’ve seen SAST tools flag a perfectly safe parameterized query as a SQL injection risk because it couldn’t understand the ORM abstraction layer sitting between the application and database. On the flip side, a carefully crafted deserialization attack using Jackson’s polymorphic type handling might sail right through because the vulnerability comes from the interaction between configuration and runtime behavior, not from obviously dangerous code patterns.

SAST excels at finding low-hanging fruit and enforcing secure coding standards. It struggles with business logic flaws, authentication bypasses that depend on application state, and vulnerabilities that emerge from the way different system components interact. When your application accepts JSON payloads and uses reflection to instantiate objects based on a type field, the vulnerability isn’t in any single line of code. It’s in the architectural decision to trust client-provided type information.

Dynamic Analysis: Poking the Running Beast

Dynamic Application Security Testing (DAST) approaches the problem from the attacker’s perspective. Tools like OWASP ZAP, Burp Suite, or commercial offerings like Rapid7 AppSpider send crafted requests to running applications and analyze the responses. They don’t need source code access, making them valuable for testing third-party applications, legacy systems, or situations where you’re assessing the security posture of something you didn’t build.

DAST tools excel at finding runtime vulnerabilities that static analysis misses. Cross-site scripting flaws, authentication bypasses, and server misconfigurations show up clearly when you’re actually exercising the application’s request handling logic. I’ve used DAST to discover subtle timing-based SQL injection vulnerabilities where the application didn’t return different content for successful versus failed injection attempts, but the response timing patterns revealed the underlying database queries.

The limitation is coverage and context. DAST tools can only test what they can reach, and complex applications often have functionality gated behind authentication, specific user roles, or particular application states. If your API requires a valid JWT token with specific claims to access administrative functions, the DAST tool needs either extensive configuration or manual assistance to explore those code paths. DAST also struggles with vulnerabilities that require deep application knowledge. A business logic flaw that allows users to manipulate their account balance through a specific sequence of legitimate API calls won’t trigger any obvious security alerts during automated scanning.

Interactive and Hybrid Approaches: Bridging the Coverage Gap

Interactive Application Security Testing (IAST) instruments the application runtime to monitor code execution during testing. Tools like Contrast Security or Hdiv Detection place sensors within the application that report when potentially dangerous code paths execute during normal testing activities. This approach combines the code-level insight of SAST with the runtime reality of DAST, providing more accurate results with fewer false positives.

IAST shines in development and QA environments where you can instrument the application and run comprehensive test suites. When your integration tests exercise the user registration flow, IAST can detect if that flow contains SQL injection vulnerabilities, even if those vulnerabilities only manifest under specific conditions that pure DAST might miss. The instrumentation provides call stack information, variable values, and data flow analysis that makes triaging findings much more straightforward.

Runtime Application Self-Protection (RASP) takes this concept into production, embedding security monitoring directly into the application runtime. While not primarily an assessment method, RASP provides continuous vulnerability detection based on actual attack attempts and exploitation patterns. I’ve seen RASP deployments catch zero-day exploits that traditional assessment methods couldn’t have anticipated because they relied on attack techniques that weren’t part of standard vulnerability signatures.

Manual Testing: The Human Element in Systematic Assessment

Automated tools find known patterns efficiently, but security vulnerabilities often hide in the spaces between what we thought we understood about our systems. Manual penetration testing brings human creativity and contextual understanding to the assessment process. A skilled penetration tester understands business logic, recognizes subtle application behaviors that might indicate deeper problems, and can chain together seemingly innocuous issues into significant security impacts.

Manual testing excels at uncovering complex attack scenarios. Consider a vulnerability chain where an attacker uses a minor information disclosure flaw to gather user enumeration data, combines that with a timing attack against the password reset mechanism to identify valid accounts, then exploits a race condition in the account lockout logic to bypass authentication entirely. No automated tool would discover this attack path because it requires understanding how these three separate issues interact in the context of the specific application.

The challenge with manual testing is scalability and consistency. A thorough manual assessment requires significant time investment from skilled practitioners, making it impractical for continuous assessment of rapidly changing applications. The quality of manual testing also varies dramatically based on the tester’s experience and familiarity with the target application’s technology stack and business domain.

Building Assessment Strategy That Actually Works

Effective vulnerability assessment requires orchestrating these different methods based on your specific risk profile, application architecture, and operational constraints. Start with SAST in your development pipeline to catch common coding errors early. Layer DAST into your QA process to verify that runtime configurations and deployments don’t introduce new attack vectors. Use IAST during comprehensive testing phases to get deeper insight into complex code paths. Schedule periodic manual assessments to explore business logic and attack scenarios that automated tools miss.

The key insight is that each method provides a different lens for examining the same system. SAST sees the code structure, DAST sees the runtime behavior, IAST sees the execution flow, and manual testing sees the human-exploitable logic flaws. Vulnerabilities hide in the blind spots where these perspectives don’t overlap. That RCE vulnerability that took down production likely lived in one of those blind spots, visible to the right assessment approach but invisible to the method your team happened to be using.

Think about how each method would have approached that Tuesday morning production incident. What would you have needed to know about your system, your assessment process, and your risk tolerance to catch that vulnerability before it became an outage?

Why Go’s Memory Management Still Surprises Systems Engineers After Five Years

The Stack Allocation Myth That Costs You Performance

I spent three hours last Tuesday debugging why our payment processing service was allocating 40MB per request when the code looked like it should barely touch the heap. The culprit? A seemingly innocent interface{} parameter in a logging function that forced every local variable in the hot path onto the heap. This is the kind of surprise that makes seasoned C++ developers question everything they thought they knew about Go’s memory model.

Go’s escape analysis determines whether variables live on the stack or heap, but it’s more conservative than most engineers expect. When the compiler can’t prove a variable won’t outlive its function scope, it allocates on the heap. Interface assignments, taking addresses of local variables, and returning pointers to locals all trigger heap allocation. The go build -gcflags=’-m’ command reveals these decisions, but most teams discover them only when performance problems surface in production.

The Garbage Collector’s Real Performance Contract

Go’s concurrent, tri-color mark-and-sweep collector targets sub-millisecond pause times, but that headline number hides the actual performance characteristics. The collector runs when heap size doubles from the previous collection, creating allocation patterns that can surprise applications with bursty memory usage. I’ve seen microservices that handled steady 10,000 QPS perfectly suddenly struggle at 12,000 QPS because the allocation rate crossed an invisible threshold.

The GOGC environment variable controls this trigger point, defaulting to 100 (meaning collections occur when heap doubles). Reducing GOGC to 50 cuts memory usage but doubles collection frequency. Increasing it to 200 reduces collection overhead but allows memory to balloon. There’s no universal right answer. The optimal setting depends on your specific allocation patterns and latency requirements.

Memory ballast, a technique where you allocate a large slice at startup and never use it, can stabilize these dynamics by raising the baseline heap size. This tricks the collector into running less frequently for the same allocation rate. It sounds hacky because it is, but it works reliably for applications with predictable memory usage patterns.

Pointer Chasing and Cache Locality Reality

Go’s garbage collector trades memory layout control for automatic memory management, and this trade-off shows up in cache performance. Unlike languages where you control object placement, Go’s allocator spreads objects across memory based on allocation timing rather than access patterns. Linked data structures that should be hot in cache often end up scattered across different memory pages.

I’ve measured 3x performance differences between slice-based and pointer-based data structures for the same algorithms. A []struct performs dramatically better than []*struct for sequential access patterns because the structs live in contiguous memory. The pointer version forces the CPU to chase addresses across potentially cold cache lines. This isn’t theoretical performance tuning. It’s the difference between meeting SLA requirements and missing them.

The sync.Pool type provides one escape hatch for this constraint. By reusing objects instead of allocating fresh ones, you can maintain some control over memory layout and reduce GC pressure simultaneously. But Pool comes with its own complexity around proper reset semantics and the risk of accidentally sharing state between reused objects.

The Hidden Costs of Finalizers and Weak References

Go’s runtime.SetFinalizer function promises to call cleanup code when objects become unreachable, but the implementation details make it unsuitable for most resource management. Finalizers run in a separate goroutine with no ordering guarantees, and objects with finalizers require at least two GC cycles to be freed instead of one. This doubles the memory lifetime for finalized objects and can create surprising memory pressure.

I’ve seen database connection pools that used finalizers for cleanup struggle with connection exhaustion under load. The connections weren’t being freed fast enough during traffic spikes, even though the application code was properly closing them. The finalizers were queuing up faster than they could execute, creating a resource leak that only appeared under specific timing conditions.

The absence of weak references in Go forces different architectural patterns than other garbage-collected languages. Cache implementations that would use weak references in Java or C# must instead rely on explicit eviction policies or external cleanup goroutines. This isn’t necessarily worse, but it requires thinking differently about object lifecycles and cleanup responsibilities.

Memory Debugging When Simple Tools Aren’t Enough

Go’s built-in memory profiling through pprof provides valuable insights, but it samples allocations rather than tracking every one. This sampling can miss allocation patterns that only appear under specific conditions or hide the true sources of memory pressure in high-allocation code paths. The sampling rate adjusts based on allocation frequency, which means the profiler sometimes misses the very problems you’re trying to find.

Runtime metrics through runtime.ReadMemStats reveal more detailed information about GC behavior, heap sizes, and allocation patterns. Monitoring these metrics over time often reveals problems that point-in-time profiling misses. The key metrics to track include NumGC (collection frequency), PauseTotalNs (GC overhead), and Sys (total memory from OS) versus HeapSys (heap memory). Divergence between these numbers can indicate memory fragmentation or other allocator inefficiencies.

For the deepest debugging, building with race detection enabled can reveal memory safety issues that show up as mysterious allocation patterns. Race conditions sometimes trigger defensive copying or other allocation-heavy code paths that only appear under specific timing conditions. The race detector adds significant overhead, but it’s often the only way to identify these subtle bugs.

Understanding Go’s memory management isn’t about memorizing rules or following best practices blindly. It requires developing intuition about how the runtime makes allocation and collection decisions, then validating that intuition through measurement and profiling. The surprises never completely stop, but they become predictable enough to debug effectively when they matter.

Why Your Kubernetes Deployment Strategy Will Break at 3 AM (And How the Smart Teams Prepare)

Three months ago, I watched a team’s production deployment strategy collapse during a routine Tuesday night release. Their blue-green setup worked flawlessly in staging, but when they flipped traffic to the new version at scale, database connection pools saturated within minutes. The rollback took forty-three minutes because their automated health checks couldn’t distinguish between “starting up” and “fundamentally broken.” By morning, they had learned what many of us discover the hard way: deployment strategies that work in theory often fail when they meet the messy realities of production systems.

Kubernetes deployment patterns have gotten much better over the past few years, but there’s still a huge gap between what works in controlled environments and what survives production chaos. Teams often adopt deployment strategies based on theoretical benefits without considering how they’ll behave under real load, with real dependencies, and real failure modes. The most successful production deployments I’ve seen share something in common: they’re designed around failure scenarios first, not happy paths.

Rolling Deployments: The Workhorse Pattern

Rolling deployments remain the most commonly used strategy in production Kubernetes environments, and for good reason. They provide a reasonable balance between deployment speed and risk mitigation. The pattern replaces pods incrementally, typically using a maxUnavailable setting of 25% and maxSurge of 25%. This means your application never drops below 75% capacity during deployment, assuming your pods start successfully.

Here’s what most teams miss: pod readiness configuration. I’ve seen rolling deployments fail catastrophically because readiness probes were too aggressive. A microservice that needs 30 seconds to warm up caches but has a readiness probe that expects responses in 5 seconds will never successfully deploy. The deployment controller will wait indefinitely for pods that will never become ready. Configure your readiness probes with realistic timeouts and success thresholds. For most applications, an initial delay of 15-30 seconds with a period of 10 seconds works better than the default 5-second intervals.

Resource requests become crucial during rolling deployments. If your cluster runs near capacity, the scheduler might fail to place new pods, causing deployments to hang. I always recommend running production clusters at no more than 70% resource utilization to leave headroom for deployments. The alternative is deployment failures during peak traffic when you need deployment capabilities most.

Blue-Green Deployments: High-Stakes Coordination

Blue-green deployments eliminate the gradual exposure of rolling updates by maintaining two identical production environments. You deploy to the inactive environment, test it thoroughly, then switch all traffic at once. This pattern excels when you need to minimize deployment risk and can afford the resource overhead of running duplicate infrastructure.

The implementation complexity lies in state management and traffic switching. Stateless applications work beautifully with blue-green deployments. Database-backed applications require careful coordination of schema migrations and data consistency. I’ve implemented successful blue-green patterns for e-commerce platforms where we ran database migrations against the blue environment before traffic cutover, then used feature flags to handle any data inconsistencies during the brief transition window.

Traffic switching mechanisms vary significantly in reliability. Using Kubernetes services with label selectors provides the simplest implementation, but DNS propagation delays can cause inconsistent behavior. Load balancer-based switching offers more control but introduces external dependencies. The most robust implementations I’ve seen combine service mesh technology like Istio with external load balancer configuration, providing both rapid switching and detailed traffic observability during cutover.

Canary Deployments: Progressive Risk Management

Canary deployments represent the most sophisticated approach to production risk management. You route a small percentage of traffic to the new version while monitoring key metrics. If metrics remain healthy, you gradually increase traffic to the new version. If problems emerge, you can quickly route all traffic back to the stable version.

The challenge lies in metric selection and automation logic. Generic metrics like response time and error rates catch obvious problems but miss subtle issues like increased memory usage or database query patterns. The best canary implementations I’ve designed include business metrics alongside technical ones. For a payment processing service, we monitored transaction completion rates, payment gateway response times, and fraud detection accuracy alongside standard HTTP metrics.

Flagger has become the leading tool for automating canary deployments in Kubernetes environments. It integrates with service meshes and ingress controllers to provide sophisticated traffic splitting and automatic promotion or rollback based on metric thresholds. However, the configuration complexity increases significantly compared to simpler deployment patterns. Teams need solid observability infrastructure and well-defined success criteria before implementing automated canary deployments.

The Emerging Pattern: Progressive Delivery Orchestration

Looking forward, the most interesting development is the convergence of deployment strategies into orchestrated progressive delivery pipelines. Tools like Argo Rollouts and Flux let teams combine multiple deployment patterns within a single workflow. You might start with a canary deployment to 5% of traffic, automatically promote to 25% if metrics look good, then switch to a blue-green pattern for the final promotion to 100%.

This orchestration approach addresses the reality that different applications and different changes require different risk profiles. A critical security patch might warrant an immediate rolling deployment, while a major feature release deserves the full progressive delivery treatment. The tooling has become sophisticated enough to handle these workflows declaratively, reducing the operational overhead of managing complex deployment strategies.

The next evolution will likely include machine learning for anomaly detection during deployments. Instead of relying on static metric thresholds, deployment systems will learn normal behavior patterns and detect deviations automatically. Early implementations of this approach are appearing in enterprise service mesh solutions, but I expect the patterns to trickle down to standard Kubernetes tooling within the next two years.

Building Resilient Deployment Practices

The most reliable production deployment strategies share several characteristics regardless of the specific pattern chosen. They include comprehensive automated testing that runs against production-like environments. They implement gradual traffic shifting with automatic rollback triggers. Most importantly, they’re designed and tested around failure scenarios, not just success paths.

Observability becomes non-negotiable as deployment strategies grow sophisticated. You need real-time visibility into application performance, infrastructure metrics, and business outcomes during deployments. The best teams I work with can correlate deployment events with user experience metrics within seconds. This capability transforms deployment strategies from risky necessary evils into confident, data-driven operations.

What deployment patterns have proven most reliable in your production environments? The field continues evolving rapidly, but the fundamental principles of gradual risk exposure and automated decision-making seem likely to persist. How you implement those principles will determine whether your next 3 AM deployment becomes a success story or a learning experience.