The Hard-Learned Truth About Monitoring
After fifteen years of watching systems fail in spectacular and mundane ways, I’ve developed strong opinions about observability platforms. Not the kind of opinions you form from reading vendor whitepapers or attending conference talks, but the kind that emerge from being woken up at 3 AM because a critical service is down and your monitoring told you nothing useful. These are the platforms I actually reach for when building systems that matter.
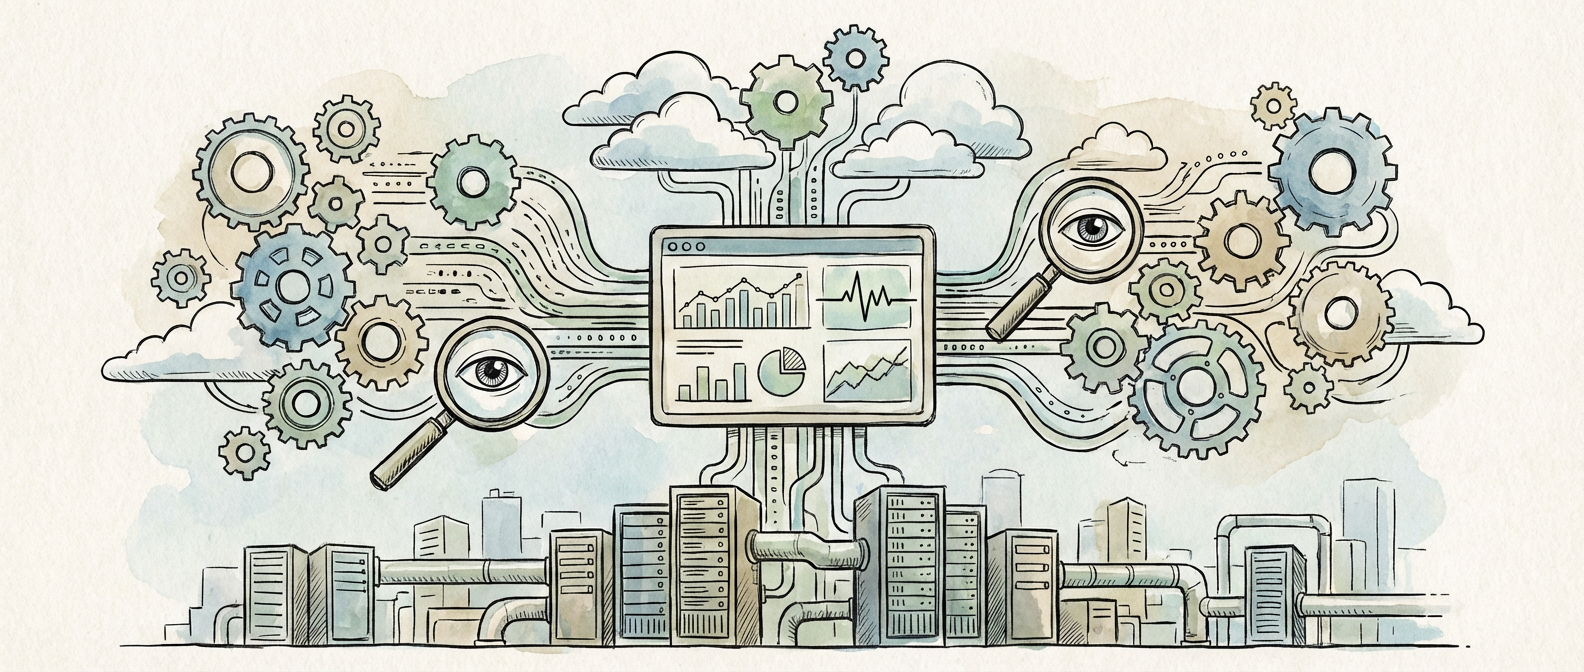
Observability has gotten ridiculously complex over the past decade. We’ve gone from simple CPU and memory alerts to distributed tracing, metrics correlation, and AIOps promises that mostly disappoint. Most teams I work with are drowning in data while staying completely blind to their actual system health. The core problem hasn’t changed: we need to quickly figure out what’s broken, why it’s broken, and how to fix it. Everything else just gets in the way.
What follows isn’t some balanced vendor comparison. This is my take on the platforms that have actually worked when systems are on fire and executives are asking uncomfortable questions. You might disagree with my choices, and honestly, you might be right for your situation. But these tools have earned their spot in my production environments by not letting me down when everything else was falling apart.

Prometheus and Grafana: The Reliable Workhorses
Prometheus is still my go-to for metrics in containerized environments. Not because it’s perfect, but because it breaks in predictable ways I understand. The pull-based model creates clarity that push-based systems muddy up. When a service stops responding to scrapes, you know immediately something’s wrong with the service itself, not just your monitoring pipeline.
Sure, Prometheus has storage limits. You’ll hit them around 10-15 million active series if you’re careless about cardinality. But those constraints actually force good habits around metric naming and retention that teams skip with “unlimited” solutions. I’ve seen way more production fires caused by runaway metrics than by Prometheus running out of space.
Grafana’s visualization has come a long way since the dark days of hand-editing JSON dashboards. The alerting isn’t as fancy as dedicated tools, but it handles 90% of what you actually need. More importantly, this whole stack just works with minimal babysitting. I can deploy it knowing I won’t spend weekends fixing my monitoring system.
The Prometheus ecosystem is quietly brilliant. There’s an exporter for everything, and building custom ones is simple enough that junior developers can add meaningful instrumentation. This democratization often beats fancy commercial features that only your senior engineers know how to use.
DataDog: When You Need to Move Fast
DataDog is expensive, but sometimes that’s exactly what you need. The agent automatically discovers and monitors common services, giving you immediate value that takes weeks to build with self-hosted solutions. For startups and teams under pressure to ship features instead of perfecting monitoring, this time-to-value difference is game-changing.
Where DataDog really shines is integration breadth and connecting the dots. APM traces link automatically to infrastructure metrics and logs, creating investigation flows that feel natural. The synthetic monitoring catches issues that pure infrastructure monitoring misses, especially those subtle slowdowns that users notice before your dashboards do. Yes, the pricing will make your CFO cry, but the alternative cost of engineering time often makes it worthwhile.
DataDog works best in mixed technology environments. The consistent experience across different languages, databases, and infrastructure reduces cognitive load during incidents. Instead of remembering which tool monitors which service, the same investigation patterns work everywhere. This consistency becomes huge during 2 AM debugging sessions when your brain isn’t firing on all cylinders.
I have to mention their mobile app. It’s genuinely useful during real emergencies. I’ve diagnosed and fixed production issues from airports and even hiking trails. This shouldn’t be normal, but having the capability provides peace of mind that’s hard to quantify but impossible to ignore once you’ve needed it.
Honeycomb: The Future of Debugging
Honeycomb takes a completely different approach that becomes more valuable as your systems get complex. Instead of pre-built metrics and fixed dashboards, it pushes high-cardinality event data that supports whatever questions you need to ask. This flexibility transforms debugging from “I hope I instrumented the right thing” to “let me ask exactly what I need to know.”
The learning curve is brutal, especially if you’re used to traditional monitoring. Writing good queries requires understanding both your system’s behavior and Honeycomb’s query language. The upfront instrumentation work is substantial, particularly when migrating from simpler metric-based approaches. But the payoff comes during those complex incidents where traditional monitoring leaves you guessing.
Distributed tracing in Honeycomb feels different from other tools. Instead of pretty waterfall diagrams, it focuses on slicing and filtering traces by any attributes you want. This reveals patterns that looking at individual traces would never show. You can quickly spot that slow requests correlate with specific user types, regions, or feature flags in ways that rolled-up metrics hide completely.
Honeycomb works best when your team already embraces structured logging and thoughtful instrumentation. If your code already emits rich, contextual data, Honeycomb amplifies that investment dramatically. For teams still dealing with legacy apps that barely log anything useful, the value is limited until you can improve the underlying data quality.
The Pragmatic Choices You Actually Make
Real production environments never match the clean scenarios in documentation. Budget limits, existing tool investments, and team knowledge influence platform decisions more than feature comparisons. I’ve run critical systems successfully on all three platforms above, and the choice often depends more on organizational reality than technical perfection.
For new projects with modern architecture and decent budgets, I start with DataDog for immediate productivity and add Honeycomb for complex services that need the investigation power. For cost-conscious setups or teams that prefer self-hosting, Prometheus and Grafana provide a solid foundation that grows with team maturity. The worst choice is endlessly debating while building systems with no observability at all.
The best observability setups I’ve seen prioritize coverage and reliability over fancy features. Simple monitoring that catches real problems beats elaborate systems that spam false positives or need constant maintenance. Start with basic metrics, logs, and alerts. Add complexity only when it solves actual problems you’ve encountered, not theoretical ones you read about.
What observability platforms have worked reliably for you in production? I’m especially curious about experiences with newer tools and how they’ve held up during real incidents. The best insights come from practitioners sharing what actually worked and what didn’t when systems were melting down.